What Is Energy Consumption in Data Center Planning
Discover what is energy consumption, how it is measured in MW and kWh, and why electricity demand drives modern data center site selection and benchmarking.
17 min read
Energy consumption is the total amount of power used by a system or facility over time. Global energy consumption reached about 606 quadrillion BTU in 2024, but for digital infrastructure the critical constraint is localized electricity demand, measured in megawatts, or MW, rather than aggregate global energy use.
That distinction changes how investors and site selection teams should interpret the market. The International Energy Agency reported that global energy demand grew by 2.2% in 2024, while electricity demand rose by 4.3%, equal to about 1,080 TWh. Electricity is therefore becoming the sharper indicator of infrastructure pressure, particularly where cloud computing, artificial intelligence, cooling, transport electrification, and industrial loads compete for limited grid capacity. (IEA global trends)
Table of Contents
- Understanding Energy Consumption in the Modern Grid
- Measuring Power Usage with Standardized Metrics
- Distinguishing Total Energy Demand from Electricity Growth
- Comparing Energy Intensity Across Commercial Sectors
- Evaluating Power Availability for Site Selection
- Benchmarking Facility Capacity and Market Scale
- Tracking Future Pipelines and Grid Constraints
Understanding Energy Consumption in the Modern Grid
The definition changes with the asset
Household energy consumption usually refers to electricity, gas, or fuel used by appliances and heating systems. A data center requires a broader accounting boundary. Its consumption includes the electricity drawn by computing equipment and by every supporting system that keeps those systems available, including cooling, power conversion, lighting, controls, and redundancy.
Power and energy describe different operating conditions. Power is the rate of electricity drawn at a specific moment. Energy is the accumulated use over a period. A facility may hold substantial contracted power capacity while recording lower energy consumption because its average load stays below the available limit.
This distinction shapes grid planning. Utilities and grid operators must assess whether substations, transformers, transmission lines, and distribution equipment can serve the facility when instantaneous demand peaks. A concentrated data center load can create local network stress even when its annual electricity use is modest in global comparisons.
Why electricity is the sharper signal
The International Energy Agency reported that global electricity demand rose 4.3% in 2024, compared with 2.2% growth in total energy demand. The agency linked electricity growth to electrification, digitalisation, and record temperatures, reinforcing the importance of power networks alongside primary fuel supply. (IEA energy demand and electricity growth)
Worldometer's compilation estimates total global energy consumption at about 606 quadrillion BTU in 2024, up from 592 quadrillion BTU in 2023, an increase of 2.4%. Fossil fuels supplied 88.5% of total primary energy, while renewables supplied 42.66 quadrillion BTU and nuclear supplied 28.39 quadrillion BTU. (Worldometer energy statistics)
Global primary-energy totals establish the scale and direction of the market. They do not show whether a particular digital hub can connect another campus. Site selection requires local evidence: firm capacity, substation upgrade timing, transmission reinforcement requirements, and the position of competing projects in the interconnection queue.
Practical rule: Global energy statistics describe market direction. Local MW availability determines whether a facility can be built.
A facility profile such as Green Schlieren data center information becomes more informative when assessed alongside grid records, planning documents, and utility connection assumptions. Location and power requirements determine development risk more directly than global primary-energy totals. For investors and site selection teams, localized electricity capacity is the binding metric because it governs connection feasibility, delivery timing, and the ability to expand.
Measuring Power Usage with Standardized Metrics
The same facility can appear small or large depending on the metric being used. Site selection teams, utilities, landlords, and operators need a shared vocabulary before they can compare projects or evaluate a power agreement.
Power capacity is an instantaneous limit
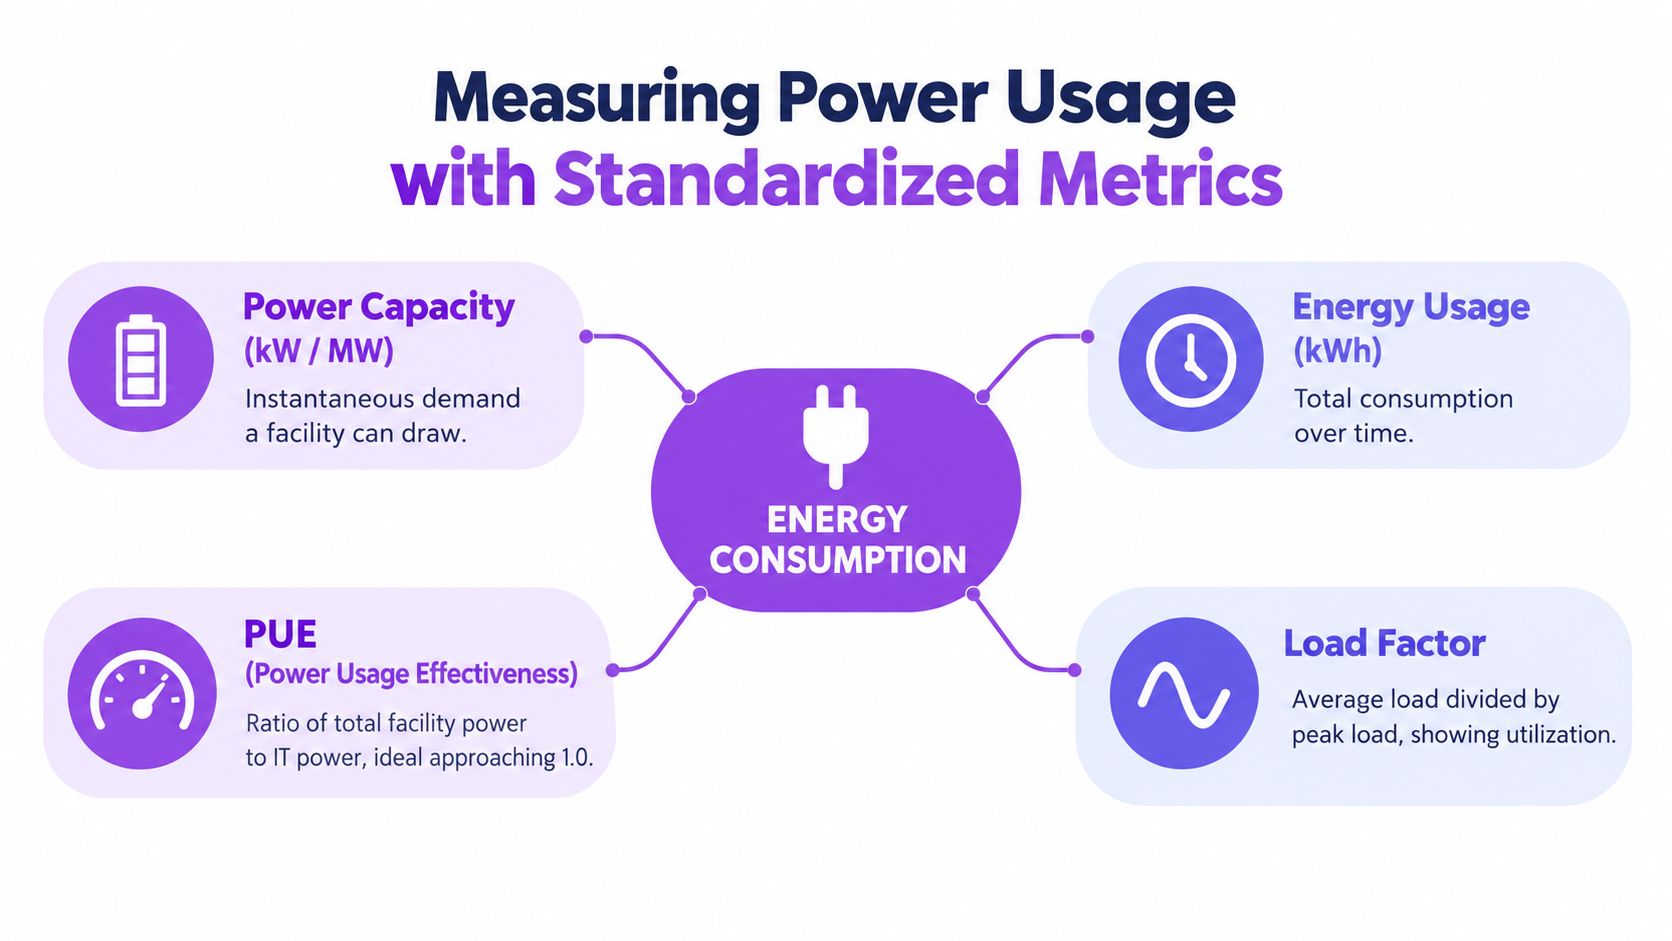
Kilowatts, or kW, and megawatts, or MW, measure power. They describe how much electrical load equipment can draw at a given moment. A data center marketed with a specified MW capacity is usually communicating the scale of its available or planned electrical load, often with a focus on IT capacity or the total facility envelope.
That number isn't the same as annual consumption. A facility with a high connection capacity may operate below its ceiling for much of the year, while a smaller site with a consistently high utilization profile may consume substantial energy relative to its installed capacity.
Megawatt-hours, or MWh, and kilowatt-hours, or kWh, measure energy. They capture the amount of electricity used over time. Utilities use energy units for billing, while operators use them to track operating costs, carbon accounting, equipment performance, and efficiency.
The relationship is straightforward:
- Power: The rate of electricity draw at a particular moment.
- Energy: The accumulated electricity used during a defined period.
- Capacity: The maximum approved, contracted, or technically available draw.
- Demand profile: The pattern formed by average, peak, and changing loads.
A useful analogy is a water pipe. MW is the size of the flow the pipe can deliver at a moment. MWh is the total volume that passes through over time. The pipe can be large without running at full flow continuously.
Efficiency and utilization complete the picture
Power Usage Effectiveness, or PUE, compares total facility power with IT equipment power. A lower ratio indicates that a greater share of the site's electricity supports computing rather than ancillary systems such as cooling and power distribution. PUE doesn't measure the value of the computing workload, but it helps analysts separate IT demand from facility overhead.
Load factor compares average demand with peak demand. A high load factor indicates that the facility uses its available capacity relatively consistently. A lower load factor can indicate a larger difference between normal operation and peak conditions, which affects how utilities and developers assess infrastructure requirements.
Teams that need to observe consumption at the equipment or facility boundary can use a consumption monitor from Connect VPP as part of a broader metering and reporting process. Monitoring doesn't replace utility data or engineering studies, but it can help reconcile measured load with contracted capacity and operational expectations.
Terminology also affects commercial interpretation. The Data Centers List terms directory provides a reference point for common infrastructure language, but analysts still need to confirm whether a published MW figure refers to IT load, total facility capacity, utility connection capacity, or a development target.
A quoted MW figure is a starting point, not a complete consumption profile. The investment case depends on what the figure includes, how much load the site can sustain, and how that demand behaves over time.
Distinguishing Total Energy Demand from Electricity Growth
Primary energy and electricity measure different parts of the system. Primary energy includes fuels consumed directly and fuels converted before reaching users. Electricity consumption measures power delivered through a grid connection or another electrical system. The distinction matters because global energy totals do not reveal whether a specific market can serve a new high-density load.
The IEA reported 2.2% growth in global energy demand in 2024, while electricity demand grew 4.3%, an increase of about 1,080 TWh. (IEA global electricity demand data) Electricity can therefore expand faster than primary energy, even while the broader system appears to have ample supply.
Aggregate supply doesn't equal local deliverability
A data center does not draw a blended global energy supply. It draws electricity through a specific connection supported by generation, transmission, substations, transformers, and distribution equipment. A region may possess substantial fuel or generation resources yet lack the deliverable capacity required for a new campus.
Grid capacity is geographically constrained. Electricity must be generated, transmitted, transformed, and delivered at the required time and voltage. If substations are full or transmission reinforcement is delayed, a project can face a connection schedule that bears little relationship to global energy abundance.
The IEA's later market reporting describes the same divergence. It reported 1.3% growth in global energy demand and around 3% growth in global electricity demand, reinforcing the importance of separating system-wide energy trends from power-sector expansion. (IEA 2025 demand developments)
The implication for digital infrastructure
Digital infrastructure participates directly in this electricity-specific acceleration. Cloud platforms, AI workloads, cooling systems, and network services convert electrical capacity into continuous computing output. The development risk is not rising worldwide energy use. It is the concentration of new demand in markets where several projects may seek connection simultaneously.
Data centers and AI are among the factors identified by the IEA as contributing to rising electricity demand, alongside cooling, industrial activity, and transport electrification. These competing loads can draw on the same constrained network, making local forecasting and connection assessment more difficult.
A capacity directory profile for the Meta 1GW Alberta campus shows why project-level visibility matters. A proposed campus can affect transmission planning, generation procurement, land values, and community debate before operations begin.
Investors should treat total energy demand as macroeconomic context, not as a direct measure of data center feasibility. Electricity growth, connection timing, and local network headroom provide the more decision-relevant signal.
Comparing Energy Intensity Across Commercial Sectors
Square footage doesn't determine power demand. Building function does. A warehouse, office, hospital, retail store, and data center can occupy substantial floor area while imposing very different requirements on electrical infrastructure.
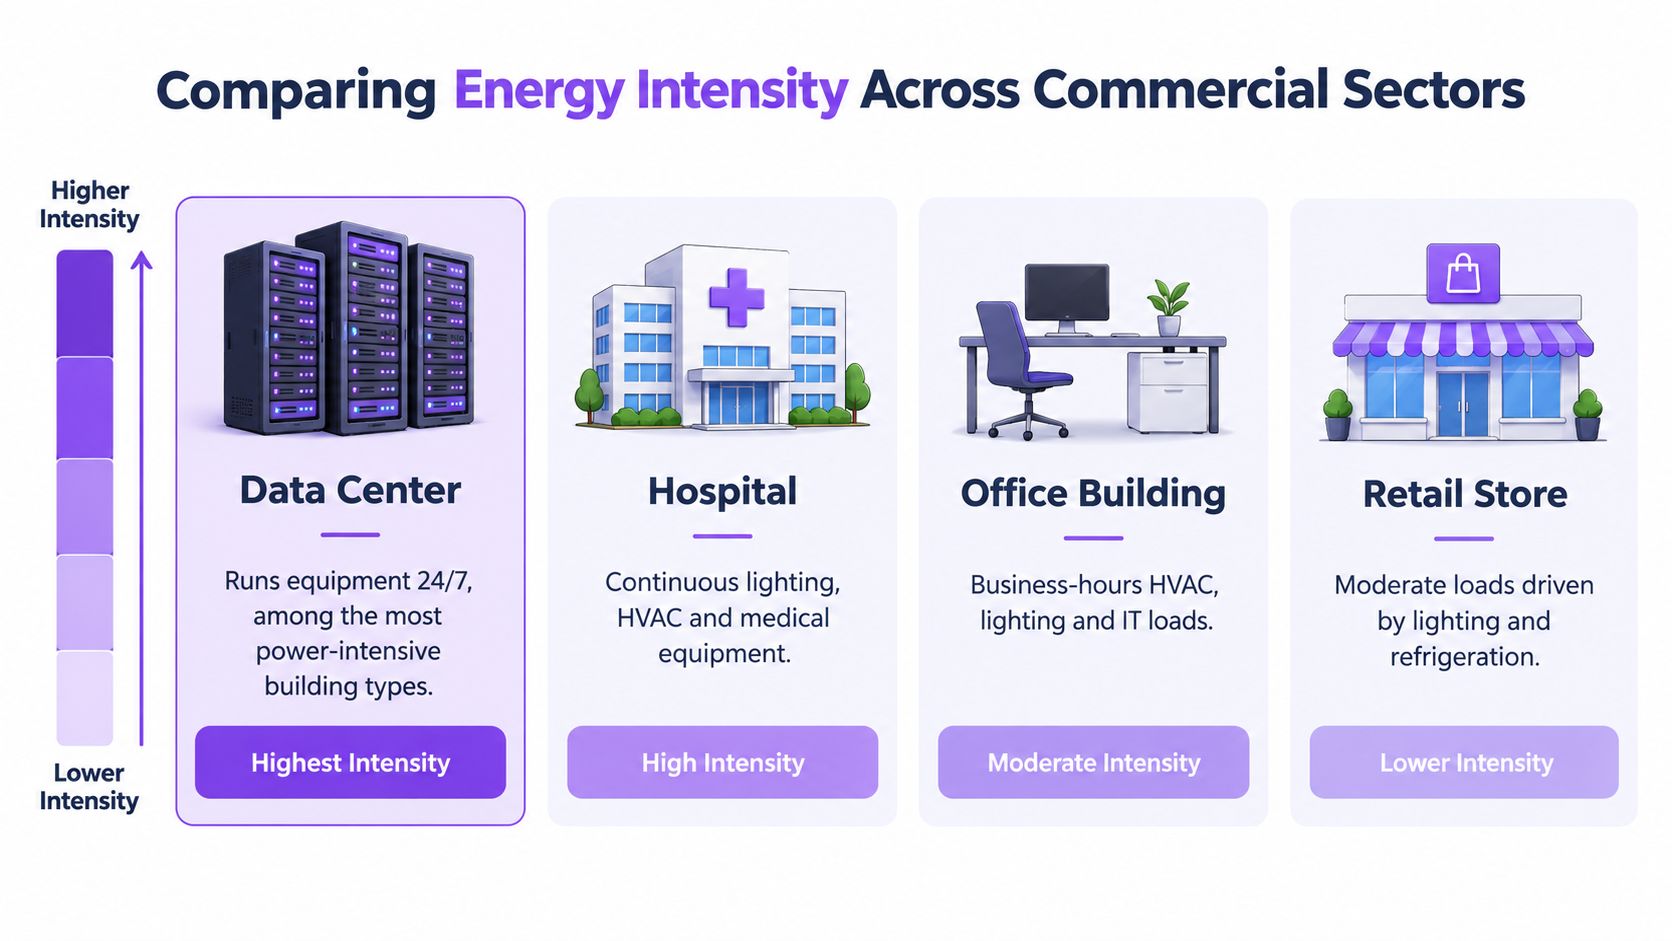
The U.S. Department of Energy identifies data centers as among the most energy-intensive building types. Its explanation says they use 10 to 50 times the energy per floor space of a typical office building, while around half or more of their power demand goes to IT equipment rather than cooling alone. (U.S. Department of Energy data center energy use)
Operational intensity matters more than footprint
An office building typically has variable occupancy, business-hours activity, lighting demand, and conventional heating and cooling patterns. Retail facilities add lighting, refrigeration, and customer-facing systems. Hospitals operate continuously and support specialized equipment, but their load profile differs from the dense, persistent computing demand of a data center.
A data center's electrical design must support servers, storage, networking, cooling, power conditioning, controls, and redundancy. The facility may have a relatively compact footprint yet require a connection that rivals much larger commercial properties. That makes raw floor area a poor basis for estimating grid impact.
The DOE's distinction between IT demand and cooling overhead also matters for investment analysis. Analysts shouldn't treat all non-IT consumption as avoidable waste, because thermal management and power conditioning are necessary to maintain availability. The more useful question is whether overhead is proportionate to the operating design and whether the facility's efficiency metrics are measured consistently.
Comparing buildings for planning decisions
A practical comparison should examine four dimensions:
- Load density: How much electrical demand is concentrated in each unit of floor area.
- Operating schedule: Whether the asset runs continuously or follows occupancy and business-hour patterns.
- Criticality: Whether interruptions affect computation, clinical operations, refrigeration, sales, or other services.
- Flexibility: Whether the load can be reduced, shifted, or interrupted during grid stress.
This framework explains why planning authorities can't evaluate data centers using ordinary commercial development assumptions. A building with fewer occupants can place greater demands on substations and transmission assets than a larger office or retail project.
Electrical condition also affects expansion decisions. Facilities and property owners assessing signs you need a service upgrade should distinguish a building-level service limitation from a utility-side capacity constraint. An upgraded internal panel may support additional equipment inside a property, but it can't resolve a shortage of upstream substation or transmission capacity.
For communities, the central issue is therefore not whether a data center is large in physical terms. It is whether its continuous, concentrated electrical load fits the existing network and whether the project sponsor can fund or schedule the required reinforcement.
Evaluating Power Availability for Site Selection
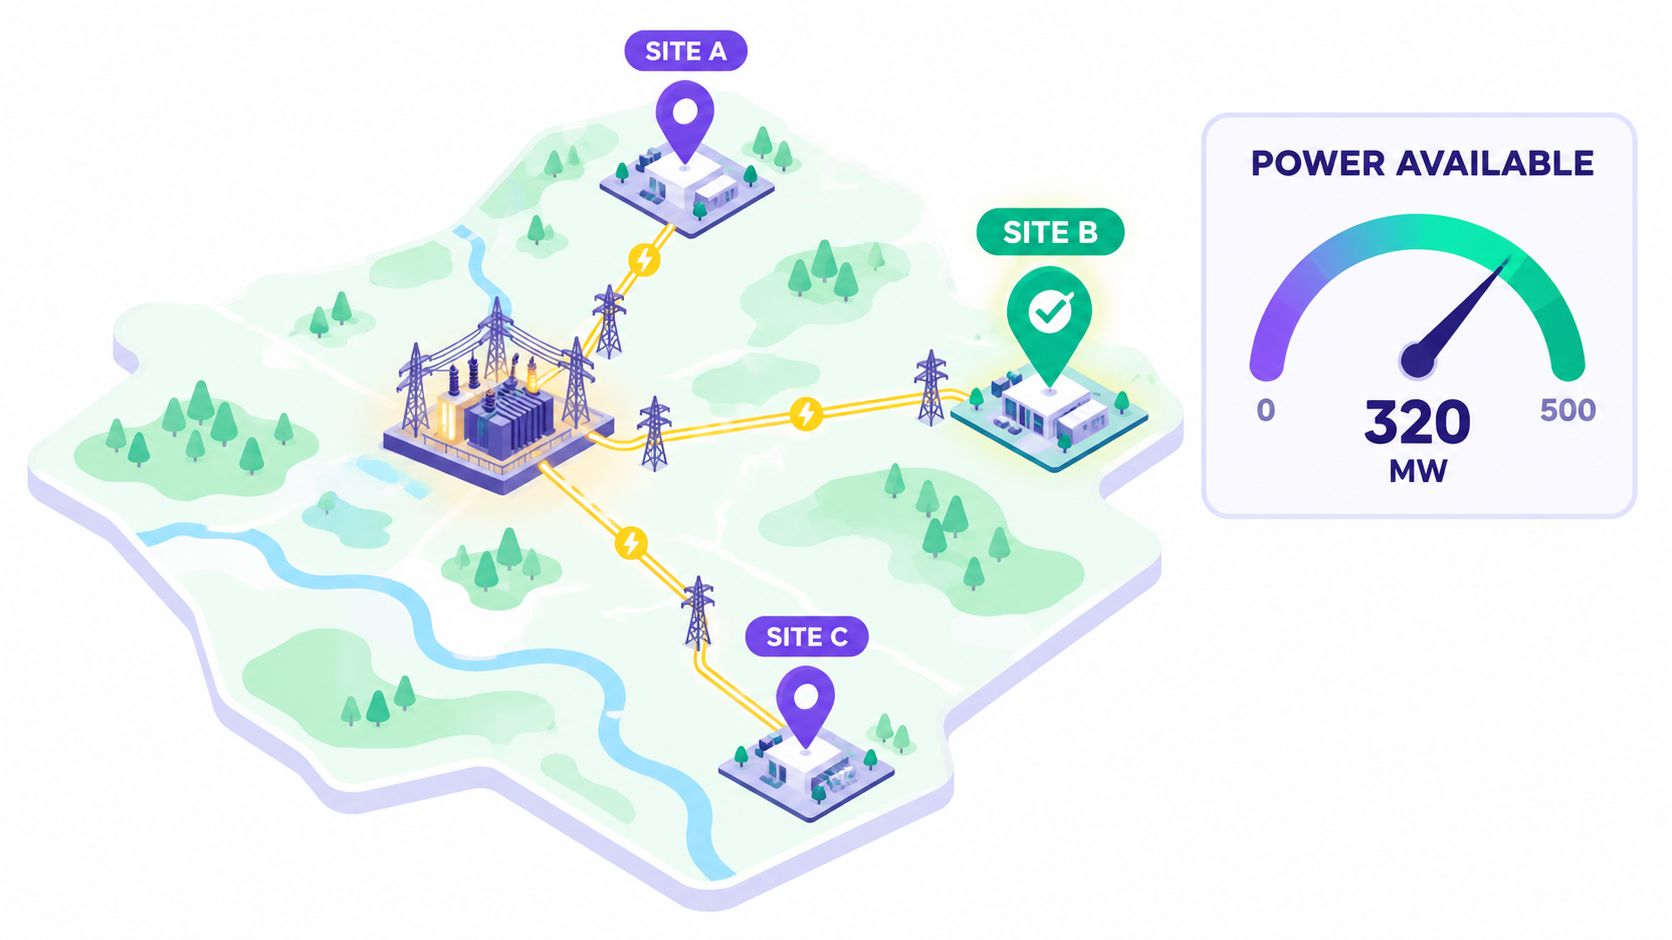
Site selection begins with a power question, but the answer can't be reduced to a utility's statement that electricity is available. Availability may mean that a line passes nearby, that a utility has accepted an inquiry, or that firm capacity can be delivered after network upgrades. Those conditions carry very different development risks.
The connection study is the commercial reality
A site selection team normally examines the relationship between the proposed IT load, total facility demand, substation capacity, transmission topology, and the expected connection date. The analysis also considers redundancy, because a site may need more than one supply path to meet its operating design.
The critical distinction is between theoretical capacity and deliverable capacity. A region may show strong generation resources, but the relevant substation can still lack transformer capacity. A nearby transmission corridor may exist, but the project may require reinforcement, permitting, or coordinated work elsewhere in the network.
Cooling adds another layer. The load presented to the grid includes more than servers, so the proposed IT capacity must be translated into a total facility requirement using an appropriate efficiency assumption. That calculation influences the size of the connection request and the economics of power procurement.
Scarcity concentrates in recognizable hubs
Power constraints become more visible when multiple large projects cluster in the same market. Northern Virginia, Dublin, London, Frankfurt, Amsterdam, and Paris are examples of major digital infrastructure locations where site selection teams must examine grid capacity, connection timing, land availability, and policy conditions together.
The correct investment question isn't only which market has the largest existing data center footprint. It is which market can add the next block of power without creating unacceptable schedule, cost, reliability, or permitting risk.
A disciplined review should test:
- Firm capacity: What electrical load can the utility commit under normal and contingency conditions?
- Delivery timing: Which upgrades are required, and are their schedules aligned with the construction plan?
- Redundancy: Can the site receive resilient supply through independent paths?
- Queue exposure: Which projects are ahead of the proposed facility, and could they consume available headroom?
- Operational flexibility: Can workloads or noncritical systems respond to constrained periods?
Site selection should rank deliverable MW by date, not theoretical MW by geography.
Where grid delivery is slow, developers may examine secondary markets, phased construction, power purchase agreements, batteries, or behind-the-meter generation. None of these options eliminates the need for engineering validation. On-site generation can introduce fuel, emissions, permitting, noise, and operating complexity, while batteries provide a specific duration and operating role rather than unlimited supply.
The strongest site is therefore not necessarily the one with the cheapest land or the largest advertised power figure. It is the site where electrical capacity, connection timing, redundancy, and local acceptance align with the deployment schedule.
Benchmarking Facility Capacity and Market Scale
Energy consumption analysis depends on consistent facility data. Public records often describe projects using different terms, while operators may disclose IT capacity, total facility capacity, phased targets, or only a broad development ambition. Investors need a common unit and a clear record of what each figure represents.
MW is the practical comparison unit for digital infrastructure. It allows analysts to compare facilities, operators, and markets even when the sites differ in building design, ownership, technology, and commissioning status. The figure becomes decision-useful only when the dataset distinguishes operational sites from planned and under-construction projects.
Disclosure quality controls the model
A capacity benchmark should separate at least three categories:
- Disclosed capacity: A figure stated by an operator, utility, planning authority, or other public record.
- AI-estimated capacity: A modeled value inferred from facility attributes and available evidence.
- Unresolved capacity: A site where the public record doesn't support a reliable estimate.
Blending those categories without labels creates false precision. A market can appear larger because an estimate has been treated as an operator-confirmed figure, or smaller because planned projects have been excluded from the count.
The same discipline applies to status. Active, planned, and under-construction sites represent different risks and different claims on future grid capacity. An active facility demonstrates that a connection has been achieved. A planned project signals intent and potential demand, but its power delivery, financing, permitting, and construction schedule may remain uncertain.
From facility records to market signals
A standardized directory can help analysts build a market view by sorting sites by capacity, location, operator, and status. Data Centers List records facility-level IT power in MW and labels figures as disclosed or AI-estimated, giving users a way to inspect the distinction rather than hiding it in an aggregate total.
That structure supports several forms of analysis:
- Portfolio benchmarking: Compare an operator's disclosed and estimated capacity across markets.
- Pipeline measurement: Separate active supply from future projects that may compete for grid access.
- Concentration analysis: Identify areas where many facilities depend on the same local infrastructure.
- Investor screening: Flag markets where planned capacity appears large relative to known connection conditions.
- Community assessment: Pair power capacity with location and other available local context.
The output shouldn't be a single headline number. It should be a transparent model showing the assumptions behind each MW figure, the confidence of the source, and the status of the underlying project.
This approach also improves communication with utilities and planners. A site list that distinguishes confirmed capacity from modeled capacity gives stakeholders a clearer basis for discussing potential load growth, rather than presenting every announced project as an equally certain future demand.
Tracking Future Pipelines and Grid Constraints
Operational facilities show what the grid is serving today. They don't show the full demand that developers, utilities, and communities may need to accommodate next. Planned and under-construction projects can reveal future pressure while permitting, land acquisition, and connection discussions are still underway.
Pipeline visibility changes the forecast
A market with a moderate operating footprint may still face substantial future demand if several large campuses are planned nearby. Conversely, a market with a large active base may have limited expansion potential if available substations, transmission routes, or local approvals are already constrained.
Pipeline analysis should track more than project names. Each record should include location, operator, status, estimated or disclosed IT capacity, expected phases where available, and the evidence supporting the entry. Community-sourced updates can be valuable when they are reviewed against public planning records and other open sources.
The distinction between statuses is essential:
- Active facilities show current electrical demand.
- Under-construction facilities indicate demand with a nearer-term path toward energization.
- Planned facilities represent potential future load whose timing and scope may change.
Water and other local resource constraints also belong in the review. A power-secure site can still face permitting or community resistance if development concentrates resource use in a stressed area. The investment committee therefore needs a combined view of capacity, timing, infrastructure, and local context.
The strategic conclusion
The question “what is energy consumption” has a different answer for a digital infrastructure investor than for a household. It means more than the electricity recorded on a meter. It includes the relationship between IT load, facility overhead, contracted capacity, utilization, connection timing, and the pipeline of competing projects.
The most important conclusion follows from that definition: future grid stress is a pipeline problem before it becomes an operating-site problem. Teams that monitor only active facilities will identify constraints after developers have already competed for land, interconnection, and power procurement. Teams that track planned and under-construction capacity can identify likely bottlenecks earlier and test alternative markets before schedules become fixed.
Investors and site selection teams should maintain a live facility dataset, label evidence quality, distinguish MW categories, and overlay project status with utility and transmission intelligence. That process turns energy consumption from a broad sustainability concept into a practical framework for evaluating whether digital infrastructure can scale in a specific location.
Data Centers List provides a searchable global directory and interactive map covering active, planned, and under-construction facilities, with facility profiles, operator details, IT power in MW, status labels, and disclosed or AI-estimated capacity indicators. Visit Data Centers List to compare markets, inspect future pipelines, and evaluate where power demand may create the next site selection constraint.