Noise Level Exposure: What It Means and How It Works
Learn what noise level exposure really measures, how dB thresholds work, and how occupational and community noise policy shapes data center siting decisions.
15 min read
Noise level exposure is not a single loudness reading, it's a dose problem. The World Health Organization estimates that about 1 in 5 people in the European Union, roughly 100 million citizens, are exposed to unhealthy levels of road traffic noise, and that at least 392,000 healthy years of life are lost each year because of road, rail, and air transport noise exposure (WHO noise overview). For infrastructure planning, that matters because the question is rarely, "Is this loud?" The key question is, "How much sound reaches people, for how long, and what does that cumulative exposure do to sleep, stress, and long-term livability?"
Table of Contents
- What Noise Level Exposure Actually Means
- How Decibels and A-Weighting Work
- Occupational, Community, and Recreational Thresholds Compared
- Why Chronic Exposure Below Occupational Limits Still Matters
- Noise Sources Common at Data Center Sites
- Mitigation Practices That Reduce Exposure
- Applying Noise Analysis to Siting and Community Impact
- A Practical Checklist for Reading Any Noise Claim
What Noise Level Exposure Actually Means
Noise level exposure is the total acoustic energy a person receives over time. That sounds technical, but the logic is simple, sound level and duration travel together. A short burst can be tolerable, while a lower sound that runs all night can create a larger public-health burden because the body has no real recovery window.
Why dose matters more than a single reading
The WHO's community-noise guidance sets less than 30 dB(A) in bedrooms at night for good-quality sleep, less than 35 dB(A) in classrooms, and less than 40 dB(A) annual average night noise outside bedrooms to help prevent adverse health effects (WHO community-noise fact sheet). Those are not hearing-damage limits. They are exposure limits meant to protect sleep, learning, and broader health outcomes.
A useful way to read any source is to separate instantaneous loudness from exposure dose. Loudness describes how a sound seems at a moment. Exposure dose describes how much sound energy the ear and body absorb after the source repeats, lingers, or runs through the night. That distinction is why a facility can sit well below occupational hearing thresholds and still create a community problem.
Practical rule: if a noise source repeats every night, the duration is part of the harm, not just the decibel number.
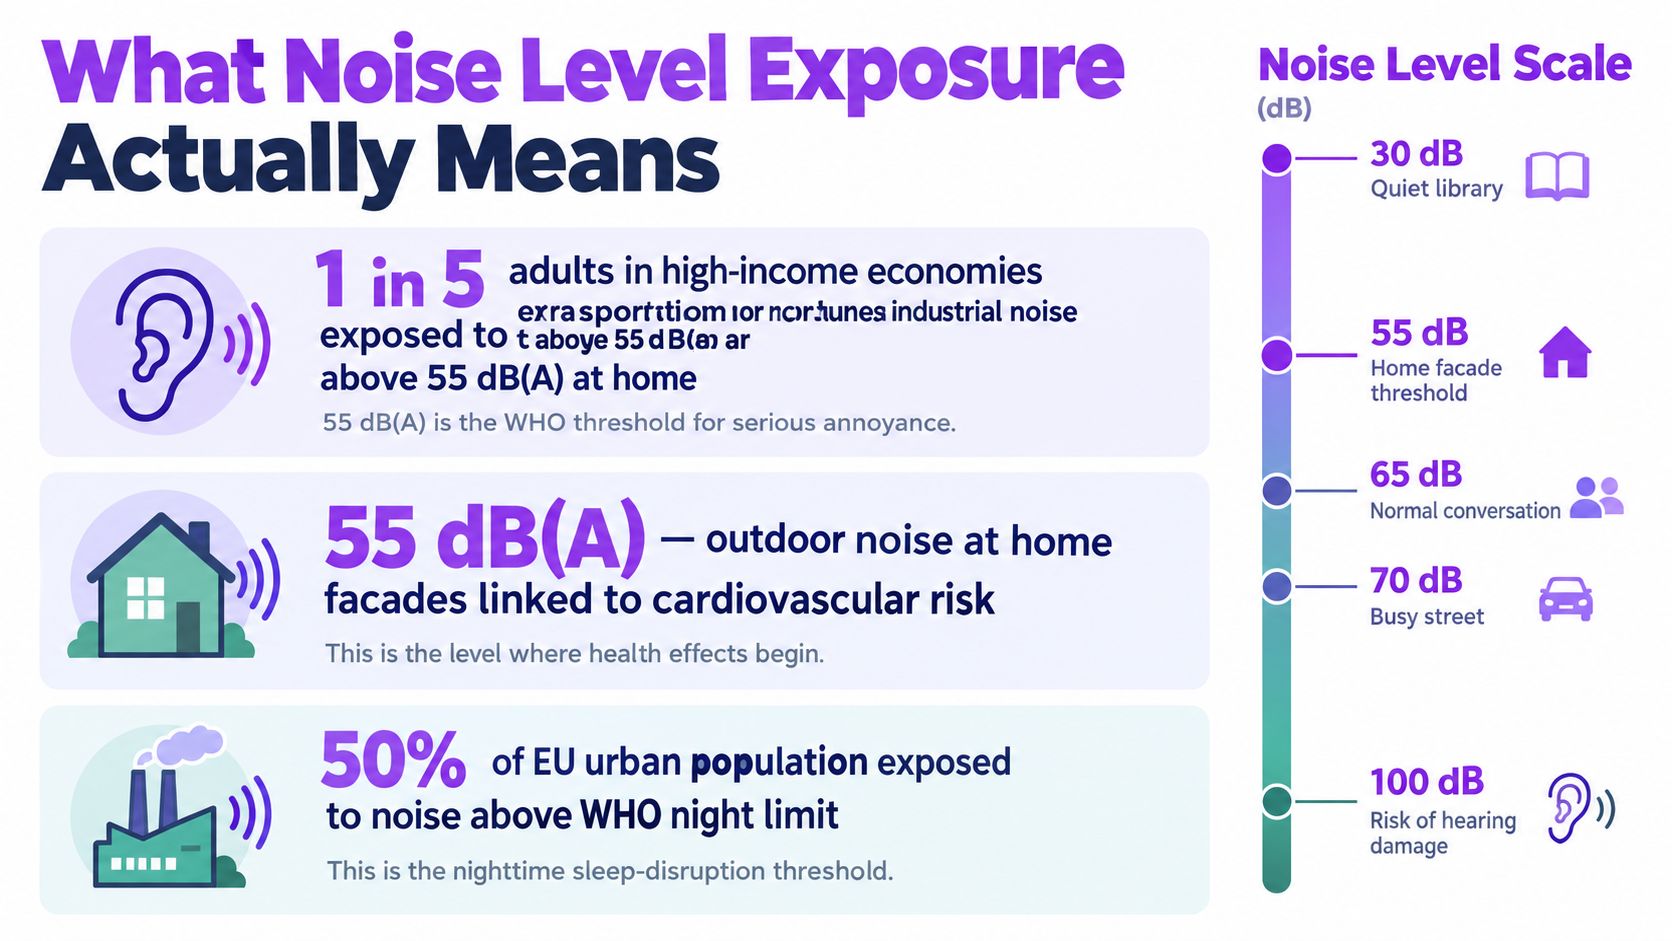
A data center that produces a steady hum overnight illustrates the point. Even if the source stays below classic workplace ceilings, a repeated nighttime pattern can still matter because residents experience it as a sustained background burden, not a one-time event. That is why noise level exposure should be read as a cumulative contact problem, not a snapshot.
How Decibels and A-Weighting Work
Decibels are a logarithmic ratio, which means each step isn't just a little louder, it represents a meaningful jump in sound energy. The standard reference is 20 µPa, the threshold of human hearing, and the scale compresses very large differences into manageable numbers. That's why two nearby readings can look similar on paper while feeling very different in practice.
The measurement tools behind the number
A-weighting, written as dB(A), adjusts the reading to reflect how human hearing responds to frequency. The ear is less sensitive to deep bass, so a raw sound-pressure reading and an A-weighted reading won't always tell the same story. That matters in siting reports because a low-frequency hum can travel farther and still create annoyance even when the A-weighted total looks modest.
The other idea that shapes exposure is the 3 dB exchange rate. Every 3 dB increase means roughly half the allowable exposure time for the same dose. In practical terms, a source that is a little louder can become a lot more restrictive once duration is included.
| Decibel reference points | Approx. level (dB(A)) | Halving of allowed time | Cumulative dose picture |
|---|---|---|---|
| Quiet bedroom edge | 30 | Not the same framework as occupational exposure | Low nighttime dose if sustained |
| Typical community background | 55 | Time still matters if it repeats nightly | Annoyance and sleep effects can accumulate |
| Office-like ambient level | 65 | Shorter allowable duration than lower ambient sound | Often acceptable by day, less so at night |
| Loud industrial or recreational sound | 85 | Allowed time is cut in half with each 3 dB rise | Dose rises quickly |
| Very loud source | 100 | Safe for only about 15 minutes under WHO guidance (WHO community-noise fact sheet) | Very short tolerance window |
A site report that shows only a single dB value without distance, duration, and weighting leaves out the part that decides whether people actually experience harm.
A few related metrics show up in planning documents. L_eq is an equivalent continuous level over a defined period. C-weighting captures more low-frequency content than A-weighting. Once those labels are understood, the next step is comparing which threshold applies to which setting, because occupational, community, and recreational noise use different rules for different outcomes.
Occupational, Community, and Recreational Thresholds Compared
A single decibel value can represent very different exposure risks. 85 dBA may define an occupational hearing-conservation limit, while a lower recurring level can still disrupt sleep in nearby homes. The correct comparison depends on the receptor, exposure duration, averaging method, and outcome being protected.
Three regimes, three different purposes
For workers, NIOSH uses 85 dBA averaged over an 8-hour workday as a time-weighted benchmark linked to lifetime hearing-loss risk (NIOSH noise guidance). Community guidance from WHO addresses residents rather than workers, with lower nighttime targets intended to reduce sleep disturbance and related health effects (WHO community-noise fact sheet). Recreational guidance frames loud events and devices as a daily dose problem, where a short period at high sound levels can consume much of the allowable exposure.
| Regime / Agency | Key threshold | Metric and averaging time | Primary outcome protected |
|---|---|---|---|
| Occupational, NIOSH | 85 dBA | 8-hour TWA | Hearing conservation |
| Community, WHO | 40 dB(A) outside bedrooms at night | Annual average night level | Sleep and adverse health prevention |
| Community, WHO | 30 dB(A) in bedrooms | Nighttime indoor target | Good-quality sleep |
| Recreational, WHO guidance summarized in public-health literature | 85 dB(A) for 1 hour | Daily exposure dose framing | Hearing risk management |
The recreational threshold is useful for interpreting concerts, generator tests, and personal listening. Public-health literature summarizing WHO guidance describes a 24-hour average of 70 dB(A) or below as generally not expected to cause hearing impairment over a lifetime, while 1 hour at 85 dB(A) reaches the recommended daily limit. The practical point is dose: a brief loud event may matter more than a longer period at a lower level, depending on the total exposure.
For data center siting, these regimes should remain separate rather than forming one compliance ladder. Worker monitoring addresses time-weighted occupational exposure. Community assessment examines recurring sound at homes, especially overnight. Recreational guidance helps interpret intermittent activities such as backup-generator testing, where a short, loud event can create a disproportionate community impact even when it does not resemble a worker's full-shift exposure. A credible report therefore states the receptor, measurement position, weighting, duration, and averaging period alongside every threshold.
Why Chronic Exposure Below Occupational Limits Still Matters
A residential block a mile from a proposed data center campus can look compliant on paper and still become a neighborhood complaint magnet. The reason is simple, people live in the sound field every night, while the facility's hearing-based thresholds were designed for a different exposure problem. In that setting, 48 dBA of nighttime cooling hum outside the nearest homes and 52 dBA during generator testing stay far below the occupational ceiling, yet they sit above the WHO's 40 dB(A) night guidance outside bedrooms (WHO community-noise fact sheet).
The mismatch between hearing limits and livability
That mismatch changes what residents notice first. They usually describe difficulty falling asleep, a persistent tonal hum, or vibration that seems to travel through walls and windows. Those complaints don't require acute hearing damage to be real. They reflect chronic exposure in a setting where the source keeps returning after dark, when people have the least tolerance for background noise.
The infrastructure analyst's conclusion is blunt. An 8-hour worker limit does not protect sleep, cognition, or neighborhood livability when a source operates all night, every night. Exposure that seems minor in a plant yard can become socially significant at the property line because the community absorbs it for thousands of hours a year, not for a shift.
Planning insight: once a sound source becomes a nightly pattern, the relevant question is whether the neighborhood can recover between exposures.
This is why community review should treat generator testing schedules, cooling plant operation, and nighttime setbacks as design variables, not afterthoughts. The issue is not just whether the noise is loud enough to injure hearing. It is whether repeated lower-level sound becomes part of the ambient environment in a way that residents can't easily escape.
Noise Sources Common at Data Center Sites
Data center acoustics usually come from three source families, and each behaves differently at the boundary. Cooling equipment creates the most persistent background, transformers add a tonal layer, and standby generation creates the loudest but most episodic events. Together, they explain why some campuses clear permitting easily in daylight and still trigger objections once the community hears what happens at night.
Cooling, transformers, and generators do not behave the same way
Cooling systems are the steady-state problem. Large air-cooled chiller fans and computer room air handler arrays commonly dominate acoustic output, and their low-frequency content can carry farther than the numbers alone suggest. Transformer pads add a tonal 60 Hz hum, which is often more noticeable than its level suggests because tonal sounds draw attention even at moderate volume.
Generators are the sharpest flashpoint because they are intermittent and intense. Monthly load tests can create brief but highly visible acoustic events that residents notice even if the annual average looks manageable. For readers trying to understand the source family rather than the complaint, the pattern is more important than the peak alone.
| Typical Data Center Noise Sources and dB Ranges | Typical dB at 1 m | Spectrum | Operating Profile |
|---|---|---|---|
| Cooling fans and air handlers | 78 to 92 dBA | Broad, often low-frequency heavy | Steady-state, long-duration |
| Step-down transformers | 65 to 75 dBA | Tonal hum around 60 Hz | Continuous or near-continuous |
| Diesel rotary UPS and standby generators | 95 to 105 dBA | Broadband, high-intensity | Intermittent testing and emergency use |
That's why siting near homes becomes a cumulative design issue. Low-frequency sound moves differently through the area, generator testing is easy to hear because it breaks the routine, and mixed-source sites can create a layered acoustic signature that's harder to mask than a single machine. A practical overview of outdoor HVAC behavior is also useful when reviewing ancillary cooling systems, and a general AC noise help resource can help non-specialists understand why fans, vibration, and installation details matter.
A campus discussion should also track how nearby facilities are being documented in planning records, including publicly visible projects such as the Blyth Power Station data centre campus. The point isn't that every site is identical. It's that the same source families tend to recur, which makes early acoustic planning worth far more than post-complaint troubleshooting.
Mitigation Practices That Reduce Exposure
Noise control works when the measure matches the source and the exposure pattern. A barrier may reduce fan noise while leaving transformer hum largely unchanged. Scheduling can reduce nighttime disturbance without lowering the generator's source level. Treat mitigation as a set of separate controls, then assess their combined effect as a dose at nearby receptors.
Match the control to the machine
Acoustic enclosures and barrier walls can reduce cooling-fan output by 10 to 20 dB at the source. Variable-frequency drives on chiller fans can lower sound while reducing energy use during part-load operation, with potential reductions of 5 to 8 dBA when ambient conditions allow. These measures address steady cooling loads. They do not resolve every tonal source or the short, high-intensity events associated with generator testing.
Design rule: treat source control, distance, and operating schedule as separate levers, not substitutes for one another.
Distance changes received exposure even when the equipment remains unchanged. Under free-field conditions, each doubling of distance provides roughly 6 dBA of attenuation. Layout therefore belongs in the initial site plan, not only in the response to complaints. Enclosure placement and building orientation can increase the effective separation between equipment and homes, while scheduling generator tests can reduce the number of nighttime events residents experience.
Enclosure and layout decisions at sites such as the Syracuse University green data center show how source control and placement work together. For material-level detail, see this guide to acoustic insulation when specifying enclosures and barrier assemblies.
| Mitigation practice | Best suited to | What it changes | What it doesn't solve |
|---|---|---|---|
| Acoustic enclosure | Cooling fans, some HVAC units | Lowers direct sound output | Doesn't remove tonal hum from all equipment |
| Barrier wall | Fan and yard noise | Reduces line-of-sight propagation | Limited against raised or diffuse sources |
| Variable-frequency drive | Part-load cooling systems | Cuts sound and energy use | Less useful for constant electrical hum |
| Setback and layout | Mixed source campuses | Lowers received level at homes | Depends on available land and terrain |
| Test scheduling | Generator events | Reduces community annoyance | Does not reduce the generator's source level |
The practical priority is clear. During early design, the lowest-cost reduction often comes from avoiding unnecessary emissions, placing noisy equipment farther from residences, and specifying source controls before construction. These choices reduce both the level and duration terms in a community exposure assessment. A schedule can limit disturbance, but only enclosure, equipment selection, and layout reduce the sound reaching the site boundary.
Applying Noise Analysis to Siting and Community Impact
Noise analysis becomes useful only when it changes a site plan. Consultants start with equipment sound-power data, then combine terrain, weather, and receptor locations to predict what reaches homes, schools, and hospitals. The output is usually a map of L_eq or L_night at the property line, which can then be checked against municipal ordinance limits and community guidance.
From model to permit decision
A strong model doesn't stop at the fence line. It maps predicted sound to the receptors that matter most, then tests whether the campus clears the envelope, needs a setback, or needs redesign of the mechanical yard and generator strategy. For that reason, the same threshold logic used in occupational work, averaging time, weighting, and duration, reappears in community planning under a different label.
A useful internal benchmark is the one used in planning records and acoustic studies for round-the-clock sites. The model should ask whether a source is acceptable by day, acceptable by night, and acceptable during testing. If the answer changes across those windows, the design still has a gap.
The planning workflow often runs through a familiar chain:
- Source inventory. List every fan bank, transformer, and generator.
- Propagation modeling. Apply distance, topography, and meteorological effects.
- Receptor mapping. Identify homes, schools, and other sensitive places.
- Threshold comparison. Check predicted levels against local limits and community guidance.
- Mitigation update. Adjust layout, enclosures, schedules, or setbacks.
That logic also applies to cumulative impact review. A new data center doesn't arrive in a vacuum. It lands beside traffic, construction, and existing industrial sound, which means the key question is how much additional dose the neighborhood absorbs once all sources are added together.
Permitting insight: a site that clears a peak-event test can still fail a chronic-exposure review if night operations are left unchanged.
Useful references for broader site planning and predictive review include a public end-to-end telecom infrastructure partner that sits in the broader infrastructure ecosystem, and the Data Center predictive modeling page that illustrates how facility-level planning data can support early screening. The value is in aligning the acoustic model with the actual approval question, not just generating a compliant-looking number.
A Practical Checklist for Reading Any Noise Claim
Every noise claim should answer the same basic questions. If it doesn't, the number is probably being used to impress, not to inform. The first thing to identify is the metric, because SPL, Leq, Ldn, SEL, and TWA each describe a different kind of exposure.
What to verify before accepting the number
A clean reading starts with the measurement setup. The second question is whether the figure is A-weighted, because a dB(A) reading and a dBC reading can't be compared as if they describe the same sound field. The third is the averaging window, since a five-minute sample, an overnight average, and an eight-hour TWA are answering different questions.
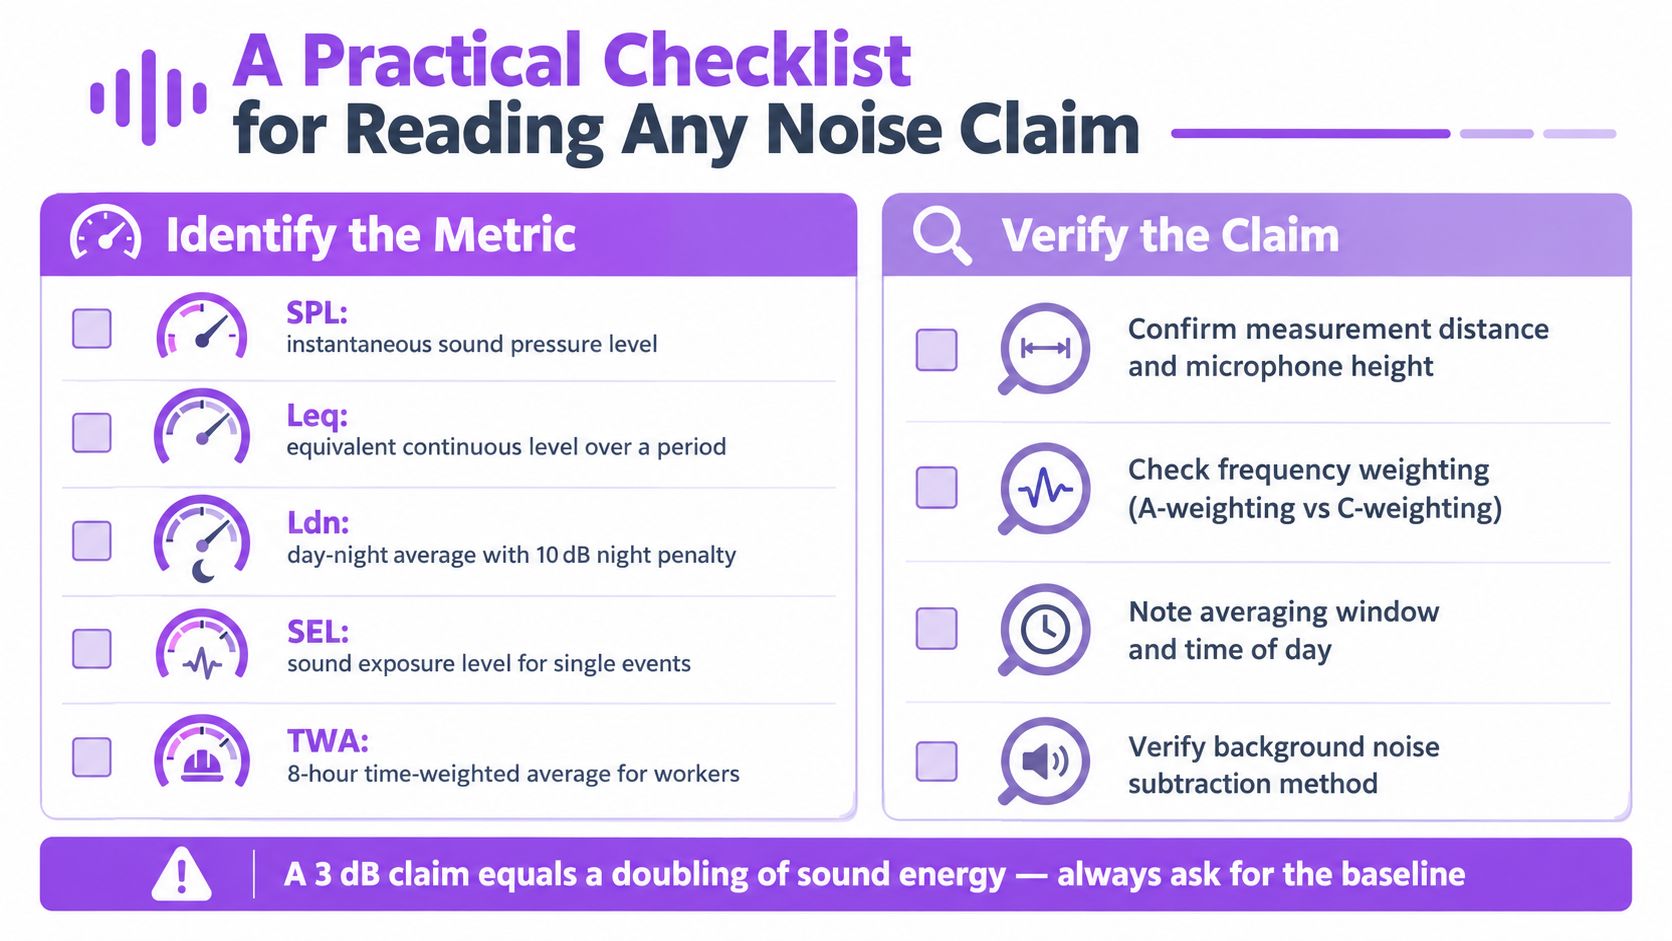
A solid review also separates source level from receiver level. A generator might be rated at one figure near the machine, but homes hear something else after distance, terrain, barriers, and runtime are added. Without those details, a number can look precise while saying very little about actual exposure.
- Identify the metric: SPL, Leq, Ldn, SEL, or TWA.
- Check the weighting: confirm whether the claim uses A-weighting or another filter.
- Verify the distance: near-source readings can't be read as property-line impacts.
- Confirm the time window: daytime, nighttime, and annual averages are not interchangeable.
- Separate testing from steady operation: generator tests deserve their own review.
- Ask about chronic effects: sleep and annoyance can matter even when hearing risk is low.
The last check is the one commonly skipped. A 70 dB generator specification is not the same thing as a 70 dB ambient reading at a bedroom window, and a 3 dB change is never trivial because it changes energy dose, not just appearance. Readers who want a practical way to evaluate projects, compare facility data, or look up market context can use Data Centers List to connect site information with the broader planning discussion.
Data Centers List gives developers, consultants, and community reviewers a way to compare facility context, location, and disclosed capacity alongside the issues that shape local impact. For readers assessing noise level exposure around data center growth, the directory and map can help connect siting decisions with the surrounding market picture. Visit Data Centers List to review facility data and use it as a starting point for better noise and community-impact screening.