10 Largest Data Centers Ranked by Power and Footprint
Explore the largest data centers by IT power and footprint, with disclosed or estimated capacity, status, profiles, and global market context.
22 min read
At 5.00 GW of IT power capacity, Hyperion is the largest active facility listed in the Data Center List ranking, and the directory identifies it as the largest facility with a publicly disclosed, non-estimated power figure. That figure equals 5,000 MW, a scale that places the leading data-center projects firmly in multi-gigawatt territory. Yet “largest” still needs careful definition. A facility can lead by IT power, physical floor area, operational status, or inclusion in a regional cluster. The China Telecom Inner Mongolia Information Park, for example, has long been associated with roughly 1 million square meters, or 10.7 million square feet, while public summaries have linked it with about 150 MW of power. The comparison changes depending on whether the ranking measures buildings or electrical load, as explained in the background on power phases for a Brisbane home.
This ranking treats the ten largest data-center categories as different analytical objects, not as interchangeable buildings. Disclosed and AI-estimated capacity should remain separate, active facilities should be distinguished from planned and under-construction projects, and an individual campus shouldn't be compared directly with an entire market hub. Data Center List supports that approach through facility profiles, sortable rankings, operator listings, status filters, map views, and local context. Hyperscale campuses, colocation sites, AI factories, private enterprise facilities, and regional clusters can be strategically important for very different reasons.
Table of Contents
- 1. Hyperscale Cloud Provider Data Centers
- 2. Colocation Facilities
- 3. Regional Data Center Clusters and Market Hubs
- 4. Enterprise On-Premises and Private Data Centers
- 5. Specialized AI and GPU-Focused Data Centers
- 6. Sustainable and Green Data Centers
- 7. Government and Defense Data Centers
- 8. Edge Data Centers and Edge Computing Facilities
- 9. Modular and Prefabricated Data Center Solutions
- 10. Distributed and Decentralized Data Center Networks
- 11. Enterprise Evidence Quality and Disclosure Gaps
- 11-Point Comparison: Largest Data Centers
- Read the Ranking Without Losing the Context
1. Hyperscale Cloud Provider Data Centers
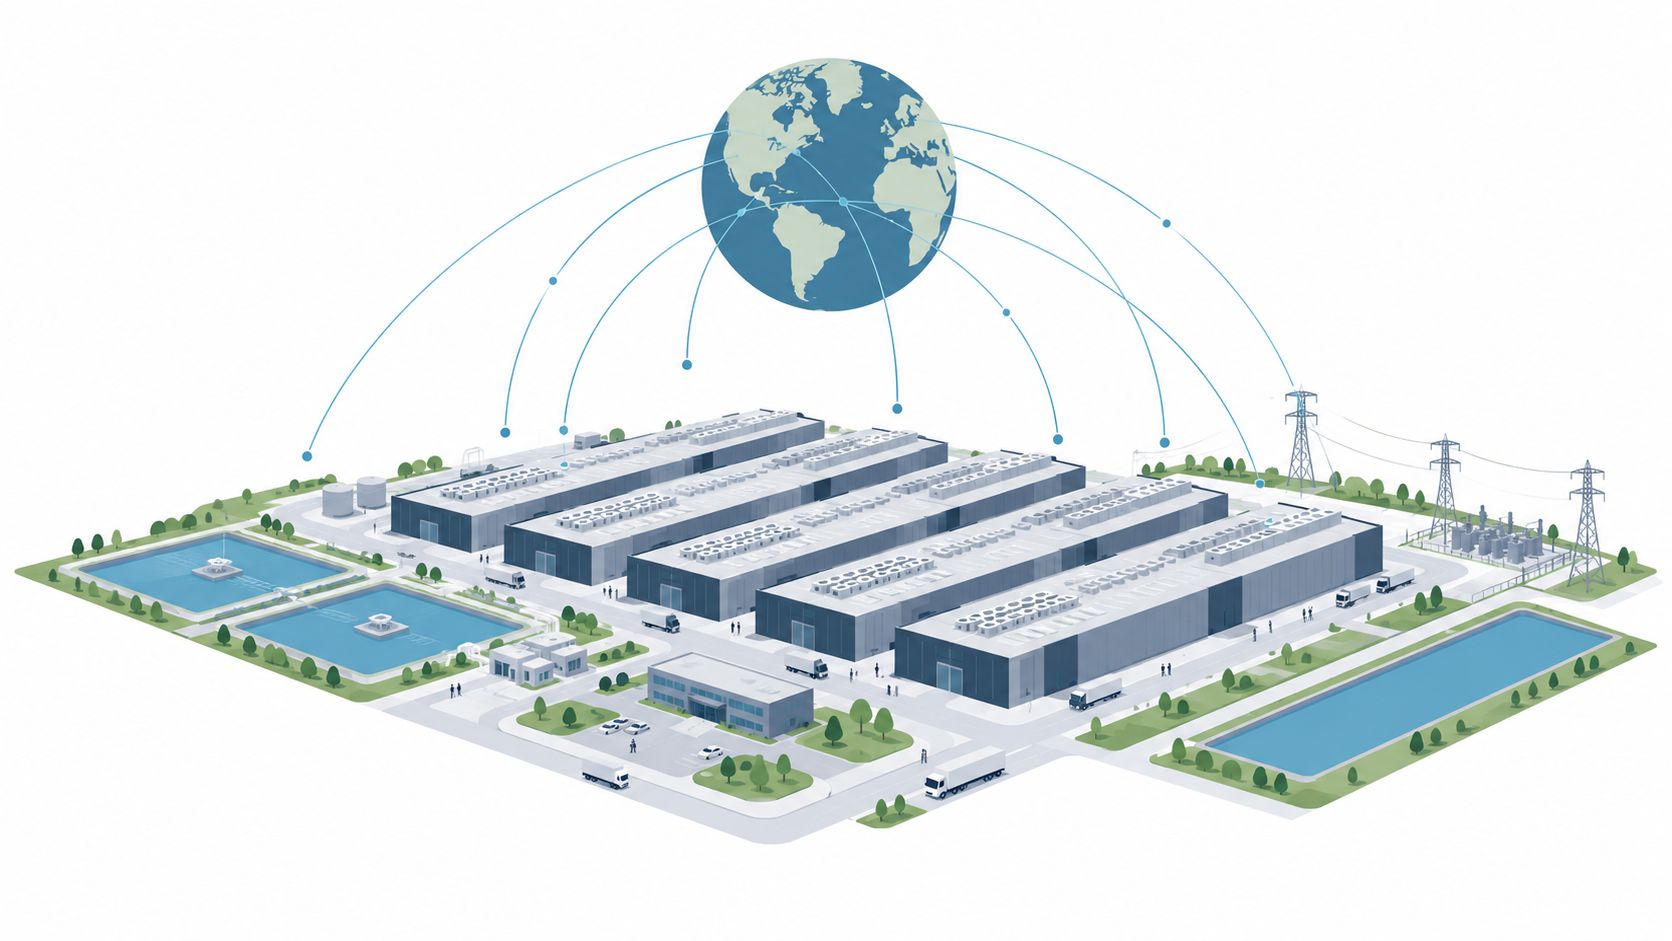
Hyperscale facilities sit at the center of global cloud delivery. AWS, Microsoft Azure, and Google Cloud operate geographically distributed infrastructure that supports many customers, workloads, and services, so the relevant unit of comparison may be a building, campus, availability zone, or regional cluster. That distinction matters for examples such as AWS US-East-1 in Northern Virginia, Google Cloud's Council Bluffs presence, Microsoft Azure facilities in Dublin, and AWS ap-southeast-1 in Singapore.
The largest hyperscale environments aren't oversized server rooms. Their importance comes from redundancy, network position, power access, and the ability to add capacity across a region. A facility with less disclosed IT power than a headline-grabbing AI campus can still be strategically critical if it supports latency-sensitive cloud services or anchors a broader operator cluster.
How to validate hyperscale scale
Data Center List's interactive map helps analysts see whether a named facility stands alone or forms part of a dense market. Its capacity rankings provide a common IT-power field, while status filters separate operating assets from projects that may alter future supply. Facility profiles also identify operators and distinguish disclosed figures from AI-estimated values, which prevents an estimate from appearing equivalent to a public utility or operator disclosure.
- Check the regional view: A single cloud provider's influence may be distributed across several nearby facilities rather than concentrated in one building.
- Separate pipeline capacity: Planned and under-construction sites indicate potential growth, not available operating capacity.
- Review local constraints: Water-stress overlays and market context can reveal risks that a MW ranking leaves out.
A facility profile such as Google Data Center Elmina Business Park illustrates why individual records should be read alongside their market context. The largest hyperscale footprint is therefore not always the most meaningful measure of cloud importance.
2. Colocation Facilities
Colocation facilities sell shared access to secure space, power, cooling, and connectivity. Unlike a captive hyperscale campus, a colocation site serves multiple customers, which can include enterprises, cloud platforms, network providers, and AI companies. That customer diversity makes colocation a different kind of “largest” facility. The operator may not control the workloads, but it can control the interconnection ecosystem and the speed with which customers reach carriers, exchanges, and partners.
Examples include Equinix IBX facilities, Digital Realty sites in major markets, CoreWeave's AI-oriented colocation footprint, CyrusOne's enterprise facilities, and Zenlayer's Asia-Pacific expansion. These examples shouldn't be ranked solely by building size. A smaller site with dense peering and scarce power can be more valuable to a customer than a larger facility in a less connected location.
Capacity is only one part of the purchase decision
Data Center List lets analysts filter facilities by operator, market, capacity, and status. That makes it possible to compare an operator's assets in one city, identify planned competitors, and examine whether apparent supply is already active or still in development. Facility records can also be cross-referenced with network resources such as PeeringDB when connectivity is central to the decision.
Practical rule: A colocation ranking should pair IT power with operator identity, status, connectivity, and local resource constraints.
Water-stress overlays add another layer. Two colocation facilities with similar power figures may use different cooling designs and face different local operating conditions. Buyers evaluating expansion should therefore use the directory to narrow the field, then verify cooling, interconnection, certifications, and contractual availability directly with the operator. The ranking identifies scale, but the facility profile and market context explain whether that scale is usable.
3. Regional Data Center Clusters and Market Hubs
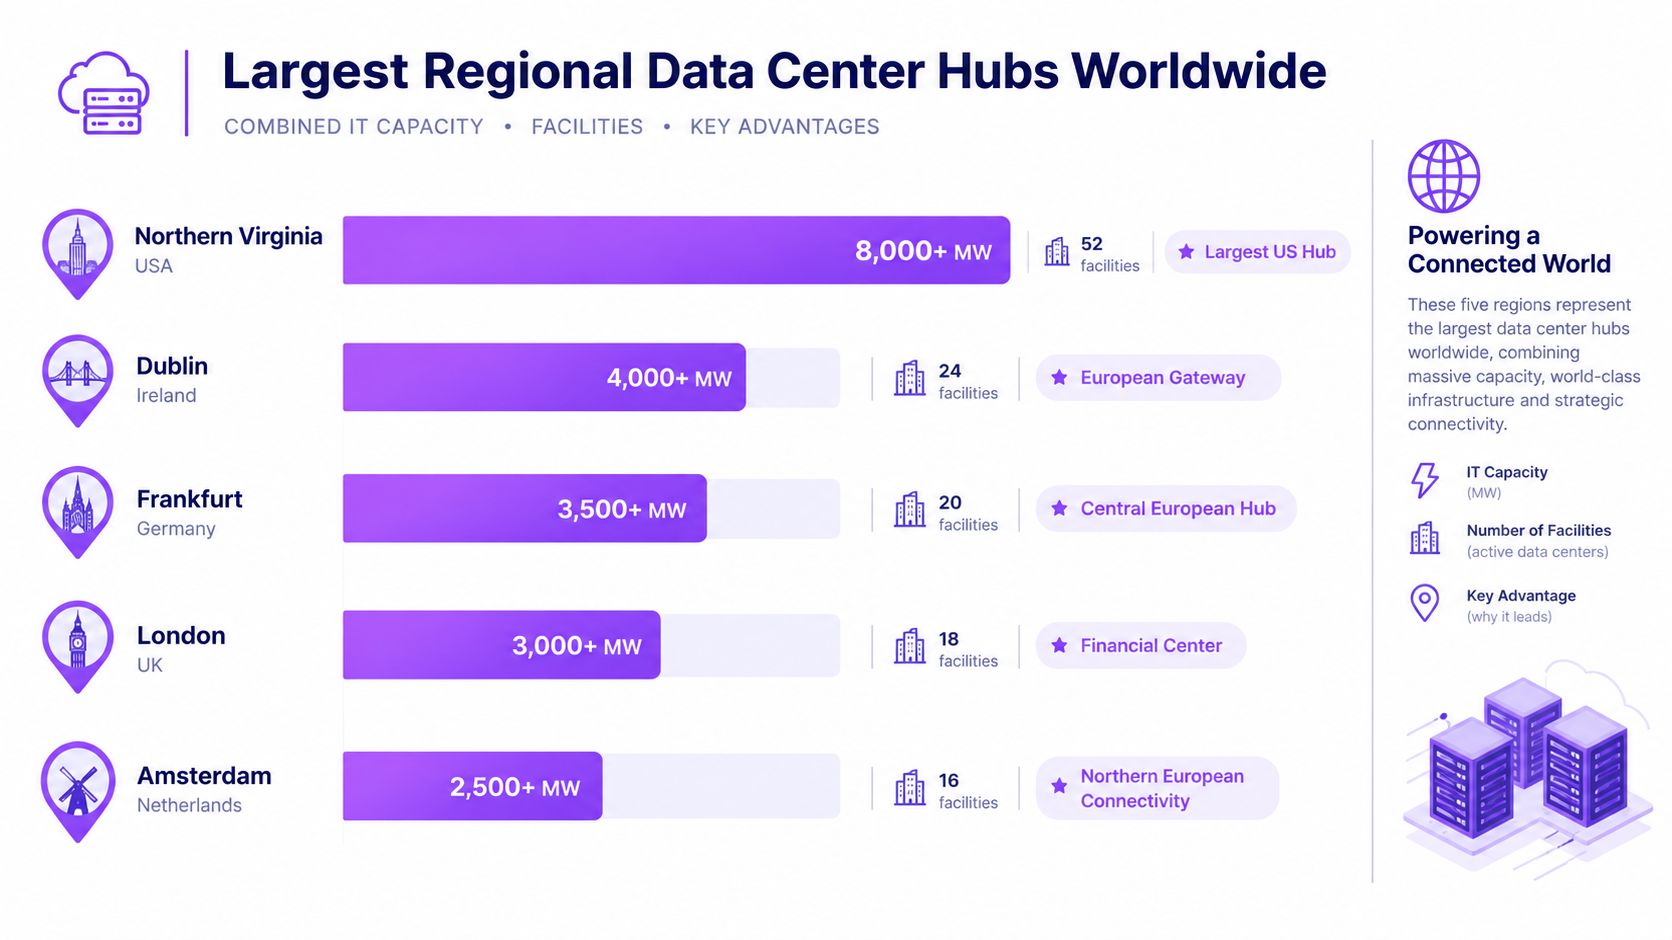
A regional cluster isn't a facility. It's a concentration of sites that collectively forms an infrastructure market. Northern Virginia, Dublin, Frankfurt, Amsterdam, and London demonstrate why cluster rankings can be more commercially important than individual-building rankings. These hubs combine network access, utility infrastructure, skilled labor, customers, and regulatory conditions across multiple properties.
Northern Virginia remains the world's largest data-center market by inventory. CBRE reported 4,496.5 MW in H1 2026, 1,135.9 MW of year-over-year growth, and 467.6 MW of net absorption in that market, while vacancy fell to 0.2%. Those figures are reported in Brightlio's data-center statistics summary. The combination indicates that demand is pressing against power availability, rather than competing for empty shell space.
Why market scale can mislead
A cluster can appear larger because it aggregates many facilities with different owners, statuses, and evidence quality. A market view should therefore distinguish active inventory from planned and under-construction capacity. It should also avoid blending publicly disclosed MW with modeled or AI-estimated values without a clear label.
Data Center List's quick-browse views for Virginia, Dublin, London, Frankfurt, Amsterdam, and Paris help analysts inspect these differences. The map's capacity-scaled markers show concentration, color-by-status views expose development patterns, and water-stress overlays add environmental context. For site selectors, the practical question isn't only which hub has the biggest inventory. It's whether a specific submarket can secure interconnection capacity, support cooling demand, and complete permitting on a realistic schedule.
The market leader may not be the easiest market to enter. In a constrained hub, power rights, transmission access, and pre-leased expansion capacity can matter more than available land.
4. Enterprise On-Premises and Private Data Centers
Enterprise on-premises and private data centers are built around control rather than customer access. A healthcare payer may keep sensitive member records and claims systems in dedicated facilities, while a utility operator may retain operational technology and grid-management workloads close to its own governance processes. Manufacturers, automotive groups, financial institutions, and public agencies use similar models when security, data location, regulatory requirements, or operating policy outweigh the flexibility of shared infrastructure.
These facilities are difficult to compare because the owner may disclose the business purpose without publishing site-level IT power, floor area, or operating status. A company's wider infrastructure program can also include leased capacity, backup sites, and smaller regional facilities. Treating that program as one data center would inflate the apparent scale.
The practical unit of analysis is the individual site. Data Center List profiles help analysts check the listed operator, location, status, and IT power, then compare those fields with corporate reports, regulatory filings, procurement records, and planning documents. This process can separate an active facility from a proposed campus, an expansion, or a corporate program that spans several sites.
Capacity alone does not determine enterprise importance. A private facility may have less IT power than a hyperscale campus yet support regulated workloads that the owner cannot place in shared infrastructure. A large site may also matter to regional power planning while offering no capacity to outside customers.
A defensible comparison records three fields before assigning a position:
- Operator: enterprise, government body, cloud provider, or third-party host.
- Capacity evidence: publicly disclosed MW, AI-estimated MW, or no usable figure.
- Operating status: active, planned, or under construction.
These distinctions keep private facilities comparable without giving uncertain estimates the same weight as documented capacity. They also clarify why an enterprise site can be strategically significant to its owner without being among the largest facilities by measurable IT power.
5. Specialized AI and GPU-Focused Data Centers
AI-focused facilities change the meaning of capacity. Traditional CPU environments often ran at 3 to 10 kW per rack under air cooling, while Uptime Institute's 2025 survey found strong adoption of racks in the 10 to 30 kW range. CBRE's H1 2026 North America reporting also notes that liquid-cooled retrofits are increasing to support new GPU rack densities. These figures are documented in CBRE's data-center trends research.
A GPU facility can therefore require a more demanding electrical and thermal design even when its total IT power is lower than that of a conventional hyperscale campus. CoreWeave AI facilities, Lambda Labs sites, NVIDIA-affiliated environments, AWS P3 infrastructure, and Microsoft Azure GPU-optimized locations belong to this category because the workload architecture, not only the building envelope, defines their role.
Density creates a different execution test
AI campuses require coordinated decisions across electrical distribution, cooling, networking, floor loading, and hardware deployment. Liquid cooling may be introduced through a new build or retrofitted into an older facility. Either way, a ranking based only on total MW can hide whether a site can support high-density GPU racks.
Data Center List helps identify emerging AI-focused operators and planned facilities, but analysts should inspect the evidence label before drawing conclusions. The directory can show where a project is located and how its reported capacity compares with other records. It can't, by itself, confirm GPU generation, usable rack density, liquid-cooling configuration, or customer allocation. Those details require operator documentation and technical due diligence.
The leading AI campus may be the one with the best combination of power certainty, cooling readiness, and network architecture, not the highest unqualified estimate.
6. Sustainable and Green Data Centers
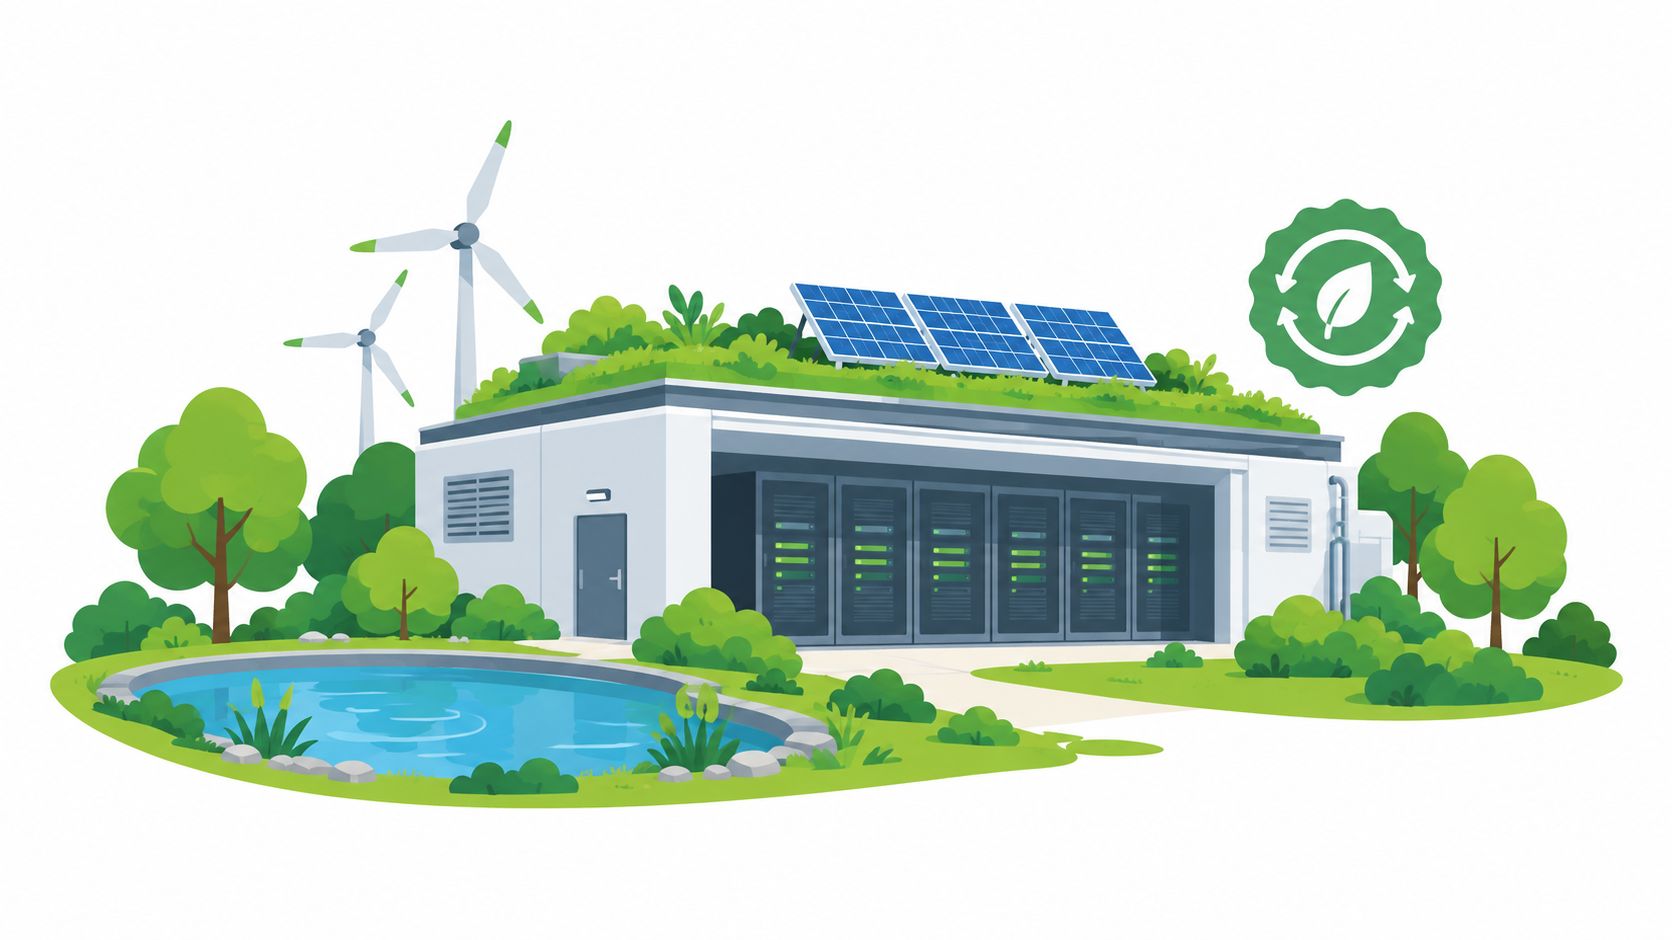
“Sustainable” isn't a single facility attribute. Renewable procurement, cooling design, water consumption, grid carbon intensity, construction impact, and local water stress can point in different directions. A large data center may use renewable energy contracts while operating in a water-stressed location, or it may use a closed-loop liquid-cooling system that sharply changes its operational water profile.
Public analysis estimates that U.S. data centers consumed about 17 billion gallons of water in 2023, with hyperscale and colocation facilities accounting for 84% of that use. The same analysis projects direct water consumption in hyperscale facilities alone could reach 16 to 33 billion gallons annually by 2028. These figures appear in Brookings' analysis of AI energy demand and regulation. The figures are estimates and projections, so they shouldn't be applied automatically to any single facility.
Cooling design changes the comparison
Microsoft's Fairwater sites illustrate a different model through closed-loop liquid cooling designed to eliminate operational water consumption. That doesn't make every AI campus water-neutral, and it doesn't remove the need to examine electricity sourcing, construction, and community impacts. It does show why two facilities with similar power capacity can have very different environmental profiles.
Data Center List's water-stress overlay helps analysts locate facilities where cooling demand may face greater local scrutiny. Operator sustainability reports can then provide the facility-specific detail, including cooling technology and energy strategy. A record such as Townsite Solar 2 Data Center Boulder Nevada can be used as a starting point for that investigation, while broader planning should include practical renewable energy options.
The strongest green ranking pairs capacity with water model, energy evidence, and local conditions.
7. Government and Defense Data Centers
Government and defense facilities should be assessed through security, sovereignty, continuity, and evidence quality, not IT power alone. Classification requirements, physical protection, compliance controls, procurement rules, and location constraints can determine the design before commercial scale enters the discussion. Public-sector infrastructure therefore represents a distinct category within any largest-data-center comparison.
The visible market is incomplete. Agencies may publish procurement documents, planning records, or facility details, while classified and sensitive sites disclose little. Data Center List can map the facilities with public records, but a low apparent capacity or ranking may indicate limited disclosure rather than limited operational importance.
Capacity is only one part of the assessment
Facility profiles can provide operator, location, operating status, and capacity fields where those details are available. Analysts should keep classification, certifications, and procurement context separate from the MW figure. A site's eligibility for government workloads may matter more to a public-sector buyer than its position in a global capacity list.
Use three evidence checks:
- Security evidence: Determine whether the record identifies secret, top-secret, or unclassified operations.
- Compliance evidence: Verify certifications and contractual eligibility instead of assuming a commercial facility satisfies government requirements.
- Pipeline evidence: Treat planned capacity as future supply, not active service.
Status differences also affect comparisons. An operating campus supports current workloads; a planned site signals possible expansion and still depends on approvals, construction, and commissioning.
Government campuses can shape surrounding development through secure employment, utility investment, and resilience planning. Those effects require public records and community context. Capacity alone cannot establish them, just as a directory record cannot fully describe a sensitive facility whose mission and specifications remain undisclosed.
8. Edge Data Centers and Edge Computing Facilities
Edge facilities move compute closer to users, devices, and network access points. Their value comes from location and latency, so a small metropolitan facility may support an application more effectively than a much larger remote campus. AWS Local Zones, Microsoft Azure Edge Zones, Vapor IO's edge network, Deutsche Telekom's edge infrastructure, and Equinix edge locations illustrate this distributed placement model.
Edge sites often sit inside or near telecommunications infrastructure, industrial areas, and urban markets. Their role can include real-time applications, 5G services, IoT processing, content delivery, and local data handling. A ranking that sorts only by total MW will naturally push these facilities down, even when their network position is central to a customer's architecture.
Map density is more useful than headline capacity
Data Center List's capacity-scaled map markers help analysts locate smaller facilities across a city or region. Filters for facilities below 20 MW can reveal edge-oriented records, while planned status filters show where operators may extend coverage. The comparison should focus on geographic distribution, carrier access, local permitting, and proximity to demand.
A facility such as Exa Edge DC Marseille Marseille is best evaluated as part of a network, not as an isolated candidate in a global power ranking. The central question is whether the site fills a coverage gap or creates a useful point of presence.
The largest edge facility isn't necessarily the most valuable one. The useful record is the site that puts the right compute near the right demand.
9. Modular and Prefabricated Data Center Solutions
Modular data centers replace some site-built construction with factory-produced units, transportable modules, or prefabricated buildings. The model can support rapid expansion, phased deployment, and locations where a conventional campus would take longer to deliver. Google Modular Data Centers, Facebook Modular Data Centers, Microsoft Mobile Data Centers, Cannon Technologies containerized solutions, and Flexential hybrid modular facilities show how the approach can appear across cloud, enterprise, and colocation environments.
A modular project shouldn't be judged solely by its initial footprint. Its strategic value may lie in deployment flexibility, repeatability, and the ability to match capacity with confirmed demand. A site can begin with a limited module and expand through additional units, but the surrounding utility, cooling, fiber, transport, and maintenance requirements still determine whether the deployment works in practice.
Pipeline status matters most here
Data Center List's planned and under-construction filters help identify modular projects before they appear in active inventory. Analysts should compare a modular proposal with a traditional build on schedule, site readiness, interconnection, equipment warranty, and operator stability. A factory-built module can shorten certain construction activities, but it doesn't remove permitting or power constraints.
For a remote industrial site, modular infrastructure may solve a space or timing problem. For a dense urban market, transport logistics and noise requirements may become more important. For a disaster-response deployment, resilience and relocatability may outweigh long-term expansion economics.
The correct ranking question is not “Which modular facility is biggest?” It's whether the design can deliver usable capacity where and when the network needs it.
10. Distributed and Decentralized Data Center Networks
Distributed networks spread computing or storage across many interconnected nodes instead of relying on one dominant campus. Filecoin's distributed storage network, The Graph's decentralized indexing model, HOPR's private internet infrastructure, Akash Network's decentralized cloud, and Chia Network's farming network demonstrate different approaches to decentralization.
These networks challenge conventional rankings because the “facility” may be only one node in a larger protocol or service. A node can contribute storage, compute, indexing, privacy, or resilience without resembling a conventional hyperscale building. The operational evidence may also vary by location, making it especially important to distinguish a mapped physical facility from a software-defined network.
Evaluate the network, then verify the nodes
Data Center List can help analysts locate emerging physical sites and examine small-capacity records, including planned facilities. Its global directory, operator information, and map views provide a geographic starting point. Analysts should then verify whether a named node is a dedicated data center, a hosted deployment, or a distributed resource operating across many independent locations.
Community impact also needs direct examination. Local partnerships, power sourcing, noise, land use, and connectivity can differ significantly between nodes. A decentralized architecture may improve resilience or reduce distance to users, but those benefits don't automatically prove lower environmental impact or easier permitting.
The most useful comparison combines protocol role with physical evidence. A network with many nodes may be resilient without having one of the largest data centers, while a conventional campus may remain the dominant physical infrastructure for the same service category.
11. Enterprise Evidence Quality and Disclosure Gaps
Enterprise infrastructure belongs in a largest-data-center ranking only after analysts separate physical scale from disclosure quality. Private operators often report data-center activity at the corporate or regional level, leaving the exact campus, IT power, and operating status unclear. A large program may therefore represent several sites rather than one rankable facility.
The evidence problem changes how comparisons should be made. A disclosed capacity figure can support a direct comparison, while an AI-estimated MW figure remains a screening signal until confirmed. Planning records may establish that a project exists, but they do not prove its final IT load or operational readiness. Active, planned, and under-construction facilities must remain separate categories.
Data Center List provides a practical starting point for checking candidate facilities. Its operator records, facility profiles, and map views can help analysts compare locations and determine whether a record includes disclosed capacity or an estimate. Corporate reports, regulatory filings, planning documents, and other public records should then be used to verify the site and its status.
A defensible private-facility record should preserve four fields:
- Facility identity: city, operator, and stated purpose.
- Capacity evidence: disclosed MW and AI-estimated MW shown separately.
- Operational status: active, planned, or under construction.
- Strategic function: workload served, such as finance, manufacturing, automotive, government, or another regulated activity.
This evidence layer limits false precision. It also explains why an enterprise site may rank below a larger disclosed campus even when its estimated capacity appears comparable. For private infrastructure, uncertainty is part of the result. A ranking that shows the evidence gap is more useful than one that converts incomplete records into an exact position.
11-Point Comparison: Largest Data Centers
| Item | Implementation complexity | Resource requirements | Expected outcomes | Ideal use cases | Key advantages |
|---|---|---|---|---|---|
| Hyperscale Cloud Provider Data Centers | High, custom infrastructure, advanced automation and proprietary systems | Very large: 50–200+ MW per facility, global networks, large operations teams | Massive scale, high availability (≥99.99%), rapid innovation and capacity growth | Global SaaS, large-scale web services, hyperscale analytics | Economies of scale, SLAs, integrated security/compliance |
| Colocation Facilities (Neutral Third-Party Hosting) | Medium, operator-managed facilities with customer equipment responsibilities | Variable: 5–100 MW, multi-carrier connectivity and interconnection ecosystems | Vendor neutrality, flexible scaling, direct control over hardware | Multi-cloud strategies, enterprise equipment hosting, peering-heavy deployments | Vendor independence, strong interconnection, transparent pricing |
| Regional Data Center Clusters and Market Hubs | High, complex coordination across many operators and dense ecosystems | Very large combined capacity: 5,000–15,000 MW per market; hundreds of facilities | Robust interconnection, competitive pricing, concentrated talent and services | Market-level deployments, peering fabrics, carrier-neutral strategies | Exceptional interconnection, redundancy, mature regulatory environments |
| Enterprise On-Premises and Private Data Centers | High, full lifecycle ownership, custom operations and staffing | Medium: 5–50 MW, high capex and dedicated operational teams | Maximum control, data sovereignty, tailored infrastructure and policies | Regulated industries, sensitive data, legacy modernization | Full control over security/compliance, no third-party SLAs |
| Specialized AI and GPU-Focused Data Centers | Very high, specialized power, liquid cooling, and dense rack engineering | High-density: 5–50 MW with 15–20 kW/rack, advanced cooling and networking | Optimized AI/HPC performance, improved perf-per-watt, fast model training | AI/ML training and inference, high-performance computing workloads | Superior AI performance, reduced thermal throttling, high throughput |
| Sustainable and Green Data Centers | Medium–high, integration of renewables, advanced cooling, certification | Variable: 10–200+ MW; renewable procurement, storage, and water-efficiency systems | Low PUE (1.1–1.3), reduced carbon footprint and long-term energy savings | ESG-focused enterprises, long-term operations with sustainability goals | Lower emissions and energy costs, improved ESG credentials |
| Government and Defense Data Centers | Very high, multi-level security, strict compliance and controlled access | Medium–high: 10–100 MW, classified infrastructure and vetted personnel | Highest security, compartmentalized operations, regulated stability | Classified workloads, national security, critical government services | Strictest security/compliance, funding stability, trusted operations |
| Edge Data Centers and Edge Computing Facilities | Medium, distributed deployment and orchestration across many small sites | Low–medium per site: 1–20 MW, many geographically dispersed nodes | Sub-10ms latency to users, reduced backhaul, localized processing | 5G, IoT, autonomous systems, real-time video and inference | Low latency, reduced bandwidth costs, rapid modular deployment |
| Modular and Prefabricated Data Center Solutions | Low–medium, factory-built modules simplify onsite construction | 5–50 MW per module; requires logistics, site power and networking | Rapid, predictable deployments with modular scalability | Remote sites, quick capacity needs, disaster recovery and temporary expansions | Fast deployment, predictable cost/quality, flexible scaling |
| Distributed and Decentralized Data Center Networks | Very high, novel coordination, blockchain/peer-to-peer orchestration | Small per node (1–10 MW) but many nodes; decentralized management tech | High resilience, ultra-low local latency, localized processing and redundancy | Web3, decentralized apps, community edge compute, local content delivery | No single point of failure, local processing, aligned with decentralized ecosystems |
Read the Ranking Without Losing the Context
A position among the largest data centers only has meaning after the measurement is identified. IT power capacity describes electrical load allocated to computing equipment, while physical footprint describes buildings or land. A regional cluster aggregates multiple facilities, and an AI-estimated figure carries a different level of certainty from a publicly disclosed value. These measures answer different questions, so they shouldn't be merged into one apparently exact league table.
Status creates another separation. An active facility contributes operating capacity today. A planned project signals an intention that still depends on financing, permits, utility agreements, equipment, and construction. An under-construction site has moved further along, but it still shouldn't be counted as active supply until the relevant capacity is online and usable. The largest project in a pipeline may ultimately be important, yet its current execution risk remains part of the analysis.
The historical comparison between physical area and power makes the point clearly. China Telecom Inner Mongolia Information Park became a famous benchmark because of its reported building area, while newer rankings increasingly emphasize electrical load. The Citadel campus has been reported at about 650 MW, and Colossus 2 has been reported near 946 MW in 2026 AI-focused rankings. Those are useful context points, but they shouldn't be presented as equivalent to Hyperion's 5.00 GW disclosed active listing, because the evidence type, facility status, and ranking basis differ. The figures are drawn from the Data Center List largest-facilities ranking.
Power availability now deserves equal attention. U.S. data-center power demand is projected to rise from 31 GW in 2025 to 41 GW in 2026 and 66 GW in 2027, according to Goldman Sachs' power-demand analysis. Those projections reinforce a practical conclusion: the most consequential facility may be the one that can secure interconnection, transmission upgrades, permitting, and community acceptance on schedule, not the one with the largest announced number.
Data Center List offers a usable research workflow through its 6,052-site directory across 175 countries, facility profiles, operator listings, sortable capacity table, status filters, map overlays, and market views. The platform labels IT power as disclosed or AI-estimated, includes active, planned, and under-construction records, and provides water-stress and local-context tools where data is available. Analysts can use it to benchmark operators, compare hubs, monitor pipeline growth, and investigate the power, water, employment, and community implications behind a ranking.
A careful reader should treat the list as a discovery and comparison system, not as a substitute for project due diligence. The strongest analysis starts with the ranked record, checks the evidence label, verifies status, separates facility from cluster, and then investigates local conditions. That process produces a ranking that is less flashy than a single undifferentiated MW number, but far more useful for investors, developers, operators, site selectors, policymakers, and communities.
Data Center List provides a searchable global directory, sortable capacity rankings, operator listings, status filters, interactive map overlays, and facility profiles that distinguish disclosed from AI-estimated IT power. Visit Data Centers List to compare the largest data centers, track planned and under-construction capacity, and assess market scale alongside power and water context.