How to Calculate Power Consumption Per Hour
Learn how to calculate power consumption per hour using kW to kWh formulas, metering methods, and real data center examples for servers, racks, and facilities.
12 min read

Energy (kWh) equals power (kW) multiplied by time in hours. The hard part is getting the kW right, because nameplate ratings ignore utilization, cooling overhead, and the way real loads behave inside a data hall.
How to calculate power consumption per hour sounds simple until the unit boundary gets blurred. The distinction matters at facility scale, where Gartner projects 565 TWh of data center electricity use in 2026, up from 447 TWh in 2025, and S&P Global places U.S. grid power for data centers at about 64.4 GW in 2025 (New Indian Express on Gartner's projection). In that setting, hourly kWh is not a classroom formula, it's the basis for planning utility feeds, racks, cooling loops, and operating margins.
Table of Contents
- The Core Formula for Hourly Power Consumption
- Key Variables That Change Your Hourly kWh Result
- Scaling the Calculation From Server to Facility
- Choosing Between Nameplate, IT Meter, and Facility Meter
- Why AI and HPC Loads Break Simple Wattage Math
- Worked Example for a 1 MW Facility Over 24 Hours
- Quick Reference Checklist for Accurate Hourly kWh
The Core Formula for Hourly Power Consumption
Facility planning now depends on accurate hourly energy figures. Gartner's 565 TWh projection for 2026 and S&P Global's 64.4 GW estimate for U.S. data-center grid power show why clean unit conversion matters at scale (Gartner's 565 TWh projection for 2026). A planner who confuses power with energy can misstate the load profile used for utility feeds, cooling capacity, and operating margins.
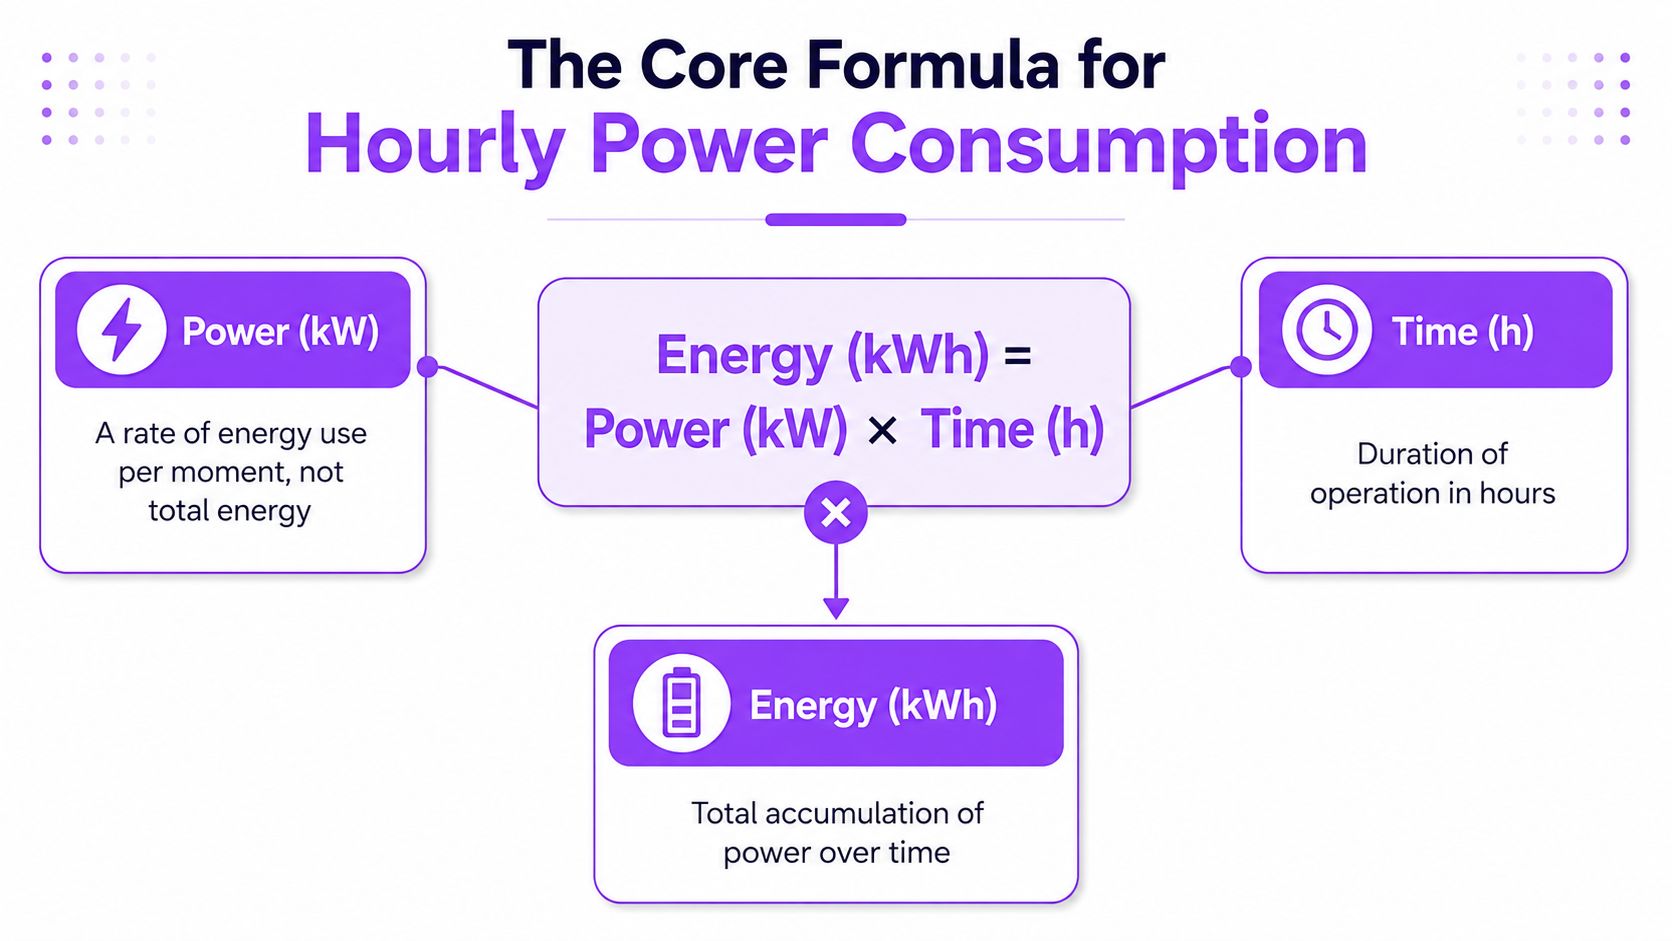
The governing relationship is Energy (kWh) = Power (kW) × Time (h). Using watts, the equivalent form is kWh = (W × h) / 1000, since 1,000 watts equal one kilowatt.
Power Is a Rate, Energy Is the Accumulation
Power describes the rate of electricity use at a given moment. Energy is the accumulated use over an interval. A 500 W device operating for one hour consumes 0.5 kWh. Operating continuously for 24 hours consumes 12 kWh.
The meter records accumulated energy, regardless of whether the input came from a nameplate rating, an IT meter, or a facility meter. That distinction matters because a wattage figure describes instantaneous demand, while the billing and capacity-planning result is usually expressed in kilowatt-hours.
Why the Simple Formula Isn't the Whole Answer
The equation remains valid. The selected power input determines whether the result reflects reality.
A server rated at 1,000 W may draw less than that under partial utilization, so multiplying its nameplate value by operating hours can overstate IT energy. Conversely, using only IT watts at a site with cooling and distribution overhead can understate utility-meter energy. A facility calculation therefore needs clearly stated assumptions for utilization and Power Usage Effectiveness, or PUE, before the result can support operational decisions.
For estimates that extend from one server to a room or campus, a documented modeling process keeps unit conversions and assumptions consistent. A predictive modeling framework for data centers can support that workflow, while analysts still need to validate utilization, overhead, and meter boundaries against the facility being modeled.
Key Variables That Change Your Hourly kWh Result
Start With the Right Power Input
The first variable is the power figure itself. A nameplate gives the maximum rated draw, but metered IT power shows what the device uses. Those are not interchangeable, and the difference becomes visible the moment a workload stops running flat-out.
Utilization and Duty Cycle Change the Shape
Utilization is the share of capacity that's active. Duty cycle is the pattern of on, idle, and burst behavior over time. A server that only spends part of the hour under load will not consume the same energy as one pinned at full output for the entire interval.
Practical rule: the lower and more irregular the utilization, the less useful nameplate math becomes for hourly kWh.
PUE Adds the Facility Layer
Power Usage Effectiveness, or PUE, converts IT draw into whole-facility draw by folding in cooling, distribution, and other overhead. A PUE of 1.58 means every 1 kW of IT load becomes 1.58 kW at the utility meter. That doesn't make the IT load wrong, it just means the meter includes more than the servers.
A simple example shows the difference. A 500 W server at 60% utilization running for one hour has an effective IT draw of 0.3 kW. At a 1.58 PUE facility, that becomes 0.474 kW at the meter for that hour. The same device would be easy to overstate if someone multiplied the nameplate by time without adjusting for load and overhead.
| Variable | Value Used | Effective kW | kWh per Hour |
|---|---|---|---|
| Nameplate rating | 500 W | 0.5 | 0.5 |
| Utilized server load | 60% of 500 W | 0.3 | 0.3 |
| Facility-adjusted load | 0.3 kW at PUE 1.58 | 0.474 | 0.474 |
The point isn't that one figure is “right” and another is “wrong.” Each one answers a different question. Nameplate is a rough inventory input, utilization is the operating reality, and PUE is the facility-level translation.
Scaling the Calculation From Server to Facility
Server Level to Rack Level
A single server calculation is only the first step. At the rack level, the analyst adds up every server's adjusted load, then includes switch, PDU, and local power losses. Redundancy also matters, because installed capacity can be higher than active capacity when the design includes N+1 or 2N headroom.
Rack Level to Row and Room Level
Once racks are aggregated, the total becomes an IT load for the row or room. That IT load is then multiplied by PUE to reach facility input power. The order matters, because applying PUE too early can inflate a partial estimate or hide where the overhead enters.
Facility Level to Hourly Energy
After the facility kW is set, hourly energy is just power multiplied by hours. A room that sits at a higher continuous load will burn more kWh over the day than a room that peaks briefly and falls back. The calculation only looks flat if the profile is flat.
A concrete pipeline keeps the math auditable. 42 servers at 350 W effective load produce 10.3 kW per rack when the rack is full, and 16 such racks at PUE 1.55 yield roughly 255 kW at the utility meter. Running that for 24 hours delivers about 6,120 kWh. The facility-level answer only makes sense because each scaling layer was handled explicitly.
A facility estimate is only as good as the point where the model changes levels, from server to rack, from rack to room, from room to meter.
For operators comparing campuses or planning expansion, a facility directory with disclosed and estimated MW values can help anchor those layers against known site profiles. Meta 1GW Alberta campus listing is an example of how power capacity context gets tied to a specific location.
| Step | What Changes | Output |
|---|---|---|
| Server level | Apply utilization | Adjusted server kW |
| Rack level | Sum servers and add local losses | Rack kW |
| Row or room level | Aggregate racks and apply facility overhead | IT load and facility load |
| Facility level | Multiply by hours | Hourly kWh |
Choosing Between Nameplate, IT Meter, and Facility Meter
Nameplate Math Is Fast but Loose
Nameplate multiplication is the fastest route to a number. It also assumes the device is running at rated load for the whole interval, which is rarely true. For budgeting or a first-pass estimate, that can be acceptable, but only if the result is treated as a ceiling, not a forecast.
IT Metering Tracks What the Compute Gear Actually Draws
IT metering reads the load at the rack or device level, usually through intelligent PDUs or UPS output. That makes it the right choice when the question is how much compute power was really used, not how much the whole building consumed. It also captures load changes that nameplate math misses.
Facility Metering Is the Billing and Planning View
Facility-level metering measures draw at the utility feed or building system boundary. That includes cooling, lighting, and distribution losses, which is why it belongs in billing, reporting, and capacity planning. It answers the question that finance and operations usually care about most, the total energy leaving the grid and entering the site.
| Method | Typical Accuracy | Relative Cost | Granularity | Best For |
|---|---|---|---|---|
| Nameplate multiplication | Low | Lowest | Device estimate | Early budgeting |
| IT metering | High | Moderate | Device or rack | Operational optimization |
| Facility metering | High for total site draw | Moderate to higher | Whole building | Billing and capacity planning |
The method should follow the decision. A procurement estimate can start with nameplate math. A load study should move to IT metering. A utility or sustainability report needs the facility meter.
Why AI and HPC Loads Break Simple Wattage Math
Dynamic Loads Move Too Fast for Static Assumptions
AI and HPC systems do not behave like ordinary office equipment. Their draw can shift with training steps, batch windows, and synchronization events, so one hourly average may conceal both peak demand and the operating profile. Nameplate multiplication gives a capacity ceiling, not a reliable hourly forecast.
The approved industry context shows why this distinction matters. S&P Global notes that some AI racks consume as much power as 80 to 100 homes, so higher-density deployments make the rack, rather than the individual server, a primary unit for capacity and cooling analysis (Gartner and S&P context). At broader scale, the sector's projected electricity demand makes accurate hourly kWh useful for facility planning, not just billing.
Cooling Changes Once Rack Density Climbs
Air-cooling assumptions become less reliable as rack power rises. Liquid systems and rear-door heat exchangers may enter the design, and their pumps, controls, and heat-rejection equipment add facility energy beyond the IT load. The hourly result can therefore change even when compute consumption remains constant, because PUE is no longer stable across operating conditions.
HPC facilities such as the HPC Center Stuttgart facility profile illustrate why rack density and cooling design belong in capacity comparisons, rather than being treated as separate from power calculations.
Operational takeaway: Profile utilization first, model cooling overhead second, then calculate hourly facility energy. Omitting one step produces a precise-looking number with weak operational value.
The formula still works. The input model needs more detail. Watts multiplied by hours can understate consumption when utilization varies widely, while a fixed PUE can misstate facility draw when cooling responds to dense AI or HPC racks.
For site selection and facility benchmarking, a directory that separates disclosed capacity from AI-estimated capacity helps analysts compare power envelopes without assuming every rack follows the same profile.
Worked Example for a 1 MW Facility Over 24 Hours
Flat Load First, Then the Operational Profile
A 1 MW critical-load facility provides a useful baseline when its demand remains constant. At 1,000 kW for 24 hours, the IT load would consume 24,000 kWh. That calculation describes a flat profile, not necessarily an operating facility. Variable utilization requires a load curve.
Assume three operating bands. Hours 0 to 6 run at 0.6 load, hours 7 to 18 at 0.85, and hours 19 to 23 at 0.95. The resulting IT energy is 4,800 kWh, 10,200 kWh, and 4,750 kWh, respectively. Total IT-bus energy is therefore 19,750 kWh.
Add Facility Overhead at the Meter
After establishing IT energy, apply PUE to estimate facility input. At PUE 1.3, the daily facility total reaches 25,675 kWh. The increment covers cooling, lighting, and distribution losses, so facility energy exceeds the IT-bus result.
| Hour Block | Utilization | IT Load (kW) | IT Energy (kWh) | Facility kWh @1.3 PUE |
|---|---|---|---|---|
| 0 to 6 | 0.6 | 600 | 3,600 | 4,680 |
| 7 to 18 | 0.85 | 850 | 10,200 | 13,260 |
| 19 to 23 | 0.95 | 950 | 4,750 | 6,175 |
The table's main value is the operating shape. A 1 MW facility does not automatically consume 24,000 kWh of IT energy each day. That figure applies only to a flat 1,000 kW load. With changing utilization, the daily total changes, and any annual forecast inherits those assumptions.
For a consistent profile, the annual facility estimate is 9,379,375 kWh. This extends the table's daily facility result across the year, so it should be treated as a forecast assumption rather than a meter reading. Changes in utilization or PUE would change the result even if the facility's rated capacity stayed at 1 MW.
Quick Reference Checklist for Accurate Hourly kWh
Run the Estimate in the Right Order
A useful hourly estimate starts with the source of the kW number. If the number came from a nameplate, it needs utilization before time is applied. If it came from a meter, it may already reflect the operating profile and only needs the correct interval.
- Check the kW source: Use metered IT data when available, not just nameplate ratings.
- Apply utilization first: Multiply the rated load by the actual operating fraction before converting to kWh.
- Include overhead at the right stage: Add cooling and distribution losses only when the target is facility-level energy.
- Recalculate for the interval: One hour is not the same as a shift, a day, or a billing cycle.
- Validate against a meter: Compare the estimate with PDU or BMS telemetry over a known period.
The final test is simple. If an estimate is more than 15% off a metered baseline, it shouldn't be accepted as a finished answer. It should trigger a metering review, because the error is usually in the input, not the arithmetic.
Data Centers List gives operators, planners, and analysts a way to connect hourly power math to real facility records, including disclosed and AI-estimated MW capacity. For anyone sizing loads, comparing sites, or checking whether a facility estimate fits the meter, visit Data Centers List and use the directory as a reference point for power capacity, status, and location context.