Data Center Power Sources: A Practical Guide
Explore data center power sources, from grid mixes to PPAs, backup generation, and onsite renewables, with procurement and carbon accounting insights.
18 min read
The International Energy Agency projects global data center electricity demand to rise from 460 TWh in 2024 to more than 1,000 TWh by 2030 and 1,300 TWh by 2035 in its base case, making power sourcing an infrastructure constraint rather than a sustainability footnote. The supply behind that growth won't come from one clean category. It will combine utility grids, contracted renewable energy, onsite generation, nuclear and gas assets, and backup systems that must respond within milliseconds.
That distinction matters because a data center can claim renewable procurement while drawing electricity from a mixed grid every hour. Operators, investors, and site selectors therefore need to separate physical power delivery, contractual energy attributes, resilience, and carbon accounting. The relevant question isn't whether a facility buys renewable power. It's which power sources serve the load, when they serve it, how the facility stays online during interruptions, and what emissions framework assigns responsibility.
Table of Contents
- Why Data Center Power Sources Matter Now
- The Grid Mix Behind the Meter
- Procurement Models and Power Purchase Agreements
- Onsite Renewables and Behind-the-Meter Generation
- Backup Power and Ride-Through Architecture
- Cooling Efficiency and Its Link to Power Sourcing
- Carbon Accounting and the Limits of Green Claims
- A Practical Checklist for Operators and Site Selectors
Why Data Center Power Sources Matter Now
The demand curve has changed the siting decision. The IEA says global data center electricity use grew to about 485 TWh in 2025 and could reach about 945 TWh by 2030, with renewables meeting nearly half of the added demand while natural gas and coal supply much of the remainder. Nuclear power is expected to become more important later in the decade, which points to a mixed transition rather than a rapid replacement of conventional generation. (IEA analysis of energy and AI)
For a developer, that forecast changes the order of operations. A parcel with available land and fiber isn't enough if the local transmission system can't deliver firm capacity, the interconnection queue is congested, or the utility can't provide a credible expansion path. Power availability now sits alongside real estate, network access, cooling design, permitting, and community constraints in the total cost of ownership.
Four power-source families
Most facilities assemble their supply from four broad families:
- Grid supply: The utility connection provides the ordinary operating feed, with its fuel mix determined by the regional system and dispatch conditions.
- Contracted renewable procurement: Physical power purchase agreements, virtual contracts, green tariffs, and certificates add contractual claims about renewable generation without necessarily changing the electrons delivered at the facility.
- Onsite generation: Solar, fuel cells, combined heat and power, batteries, and potential advanced nuclear systems can sit behind the meter or support a microgrid.
- Backup systems: UPS equipment, batteries, flywheels, and generator sets protect the load when the grid experiences a disturbance or outage.
Each family solves a different problem. Grid electricity offers scale but exposes the facility to local capacity and carbon conditions. Renewable contracts can support emissions reporting and long-term price planning, but they require careful examination of delivery, timing, additionality, and certificate ownership. Onsite assets reduce dependence on a single interconnection, while backup systems prioritize continuity over everyday energy economics.
Practical rule: A power-source claim should always answer four questions: what serves the load, where it is generated, when it is available, and which accounting method assigns its emissions.
The core trade-off repeats across every project. Reliability requires firm, controllable capacity. Lower cost often favors existing grid infrastructure or dispatchable generation. Lower carbon may require additional contracts, storage, transmission, or firm low-carbon generation. A defensible strategy doesn't hide those tensions. It makes them explicit.
The Grid Mix Behind the Meter
A data center's physical electricity usually follows its regional grid, not its supplier's marketing language. Globally, renewables provide about 27% of electricity consumed by data centers, natural gas 26%, nuclear 15%, and coal about 30%, with coal's contribution highest in China. (IEA data center energy supply analysis)
The United States has a different profile. Data centers consumed about 183 TWh in 2024, more than 4% of total U.S. electricity demand, roughly equal to Pakistan's annual power consumption. Natural gas supplied over 40% of U.S. data center electricity, wind and solar about 24%, nuclear about 20%, and coal around 15%. (Pew Research summary of U.S. data center energy use)
Regional context matters more than a national average
National figures conceal the conditions at a specific connection point. A facility tied to a gas-heavy regional system has a different operational carbon profile from one connected to a hydro- and nuclear-rich system. That difference can affect permitting discussions, emissions disclosures, renewable procurement design, and the firm generation required for expansion.
| Region | Gas | Coal | Nuclear | Hydro | Wind/Solar |
|---|---|---|---|---|---|
| Global data center supply | 26% | 30% | 15% | Included in renewables | Included in renewables |
| United States data center supply | Over 40% | Around 15% | About 20% | Not separately provided | About 24% |
The table uses only fuel shares provided in the cited IEA and Pew summaries. It does not imply that every U.S. market has the national fuel mix, or that renewable generation has the same value in every hour.
Marketed supply and marginal supply differ
A utility may offer a renewable tariff, or a data center may sign a wind or solar contract. These arrangements can support market-based accounting, price hedging, or new project development. They do not necessarily mean that renewable electricity reaches the facility while its servers consume power.
The marginal generator matters during constrained hours. If a regional system dispatches gas or coal units to meet incremental demand, the facility's location-based emissions can rise even when its annual contractual portfolio appears clean. Facility analysis should therefore record the grid region, connection point, congestion exposure, and procurement structure separately, rather than reducing them to one renewable percentage.
A credible disclosure distinguishes between physical grid dependence and contractual energy attributes. Physical dependence identifies the infrastructure required to keep the site online. Contractual attributes support buyer claims under applicable accounting rules, but they do not erase the emissions profile of the electricity system serving the facility. Mixed procurement is therefore the practical baseline, with reliability, cost, grid constraints, and carbon accounting assessed together.
Procurement Models and Power Purchase Agreements
Procurement routes differ less by environmental label than by physical delivery rights, market structure, buyer scale, and credit capacity. A retail-scale operator may remain on a standard utility tariff because it lacks the load size or flexibility to negotiate bilateral supply. A large campus may combine utility service with a physical PPA, a virtual PPA, onsite generation, and certificates.
| Model | Best Fit | Market Type | Tenor |
|---|---|---|---|
| Utility tariff supply | Retail-scale and smaller operators | Regulated or vertically integrated markets | Contract terms vary |
| Physical corporate PPA | Large buyers able to receive contracted generation | Bilateral or organized markets with delivery options | Often long term |
| Virtual PPA | Buyers seeking contractual renewable attributes without physical delivery | Markets where financial settlement is available | Often long term |
| Direct wire or behind-the-meter arrangement | Campuses co-locating generation and load | Sites with suitable land, permits, and interconnection design | Project-specific |
Utility supply remains the baseline
A utility tariff is operationally simple. The facility receives service through the local distribution and transmission system, pays the applicable tariff, and relies on the grid operator or utility to balance supply and demand. This arrangement can be the only practical route in regulated markets, but it exposes the buyer to local generation, transmission congestion, capacity charges, and future rate decisions.
A physical PPA can provide a stronger connection between a buyer and a generating asset. It fits markets where the buyer can take physical delivery or arrange delivery through an eligible market structure. The contract still doesn't remove the need for grid balancing. Wind and solar output varies, while the data center load typically requires continuous service.
A virtual PPA is financially settled. The buyer and generator agree on a contract price, then exchange payments based on the difference between that price and a market reference. The facility continues to receive ordinary grid electricity, while the contract can transfer renewable certificates and create a financial hedge. This model suits buyers in markets where direct bilateral delivery isn't practical.
Direct-wire and behind-the-meter arrangements offer the clearest physical connection between generation and load, but they also create the heaviest site burden. The developer must address land, protection systems, permitting, operating responsibility, fuel supply, and contingency service when onsite output falls short.
Contract design determines the claim
Long-term contracts can support new generation, but contract length alone doesn't prove that a facility's hourly consumption is carbon-free. Buyers increasingly examine delivery region, project commissioning date, certificate vintage, load matching, curtailment treatment, and replacement power provisions. Time-of-use matching and 24/7 carbon-free energy pilots add stricter requirements because they test whether procurement follows the facility's consumption pattern rather than only its annual total.
For a concrete view of how a large campus can be presented in a regional context, analysts can review the Lancium Clean Campus in Hall County, Texas. The relevant lesson isn't that one model works everywhere. It's that procurement should be evaluated alongside the market's physical constraints and the facility's operating profile.
Onsite Renewables and Behind-the-Meter Generation
Onsite generation works best as a layered system, not as a single substitute for grid service. Rooftop and carport solar can reduce daytime purchases, while fuel cells, combined heat and power, batteries, or other dispatchable assets can support a more controlled microgrid. The correct mix depends on land, roof area, interconnection headroom, water availability, fuel logistics, and local permitting.
Solar is usually the easiest asset to understand and the hardest to scale to the full load of a hyperscale campus. A large site may have substantial roof and parking areas, but the available footprint still limits output. Solar production also varies with weather and daylight, so it needs grid support, storage, or dispatchable generation if the facility wants firm power.
Dispatchable assets change the design problem
Fuel cells provide steady output and can occupy less land than a large solar field. Their economics depend on equipment cost, fuel source, maintenance, heat recovery, and emissions rules. CHP can improve total fuel utilization when a nearby process needs useful heat or steam, but a data center that has little thermal demand may not capture its full value.
Small modular reactors remain a potential future option rather than a generally available solution. They require a suitable regulatory framework, nuclear siting approval, security planning, fuel arrangements, and community acceptance. Hydrogen storage and fuel-cell projects face their own permitting and supply-chain questions.
The following comparison uses only qualitative ranges where the brief doesn't provide verified values. Precise installed costs, capacity factors, and load shares require project-specific engineering and shouldn't be generalized.
| Technology | Capacity Factor | Installed Cost | Land Use | Typical Load Share |
|---|---|---|---|---|
| Solar PV | Variable and weather-dependent | Site-specific | Requires roof, carport, or ground area | Usually a supplement |
| Fuel cells | Designed for steady operation | Site-specific | Relatively compact | Depends on modular deployment |
| CHP | Dispatchable, linked to fuel and heat demand | Site-specific | Requires equipment and fuel infrastructure | Depends on thermal and electrical demand |
| Small modular reactor | Intended as firm generation, subject to deployment status | Site-specific | Requires licensed nuclear site | Potentially substantial, where permitted |
For analysts reviewing facility records, the key question is whether an onsite asset serves load or supports a sustainability narrative. A solar array that offsets some daytime purchases is useful, but it doesn't replace the utility connection, UPS plant, or standby generation. A facility profile such as the Townsite Solar 2 Data Center in Boulder City, Nevada should therefore be read alongside disclosed capacity, status, interconnection details, and the wider regional supply system.
Backup Power and Ride-Through Architecture
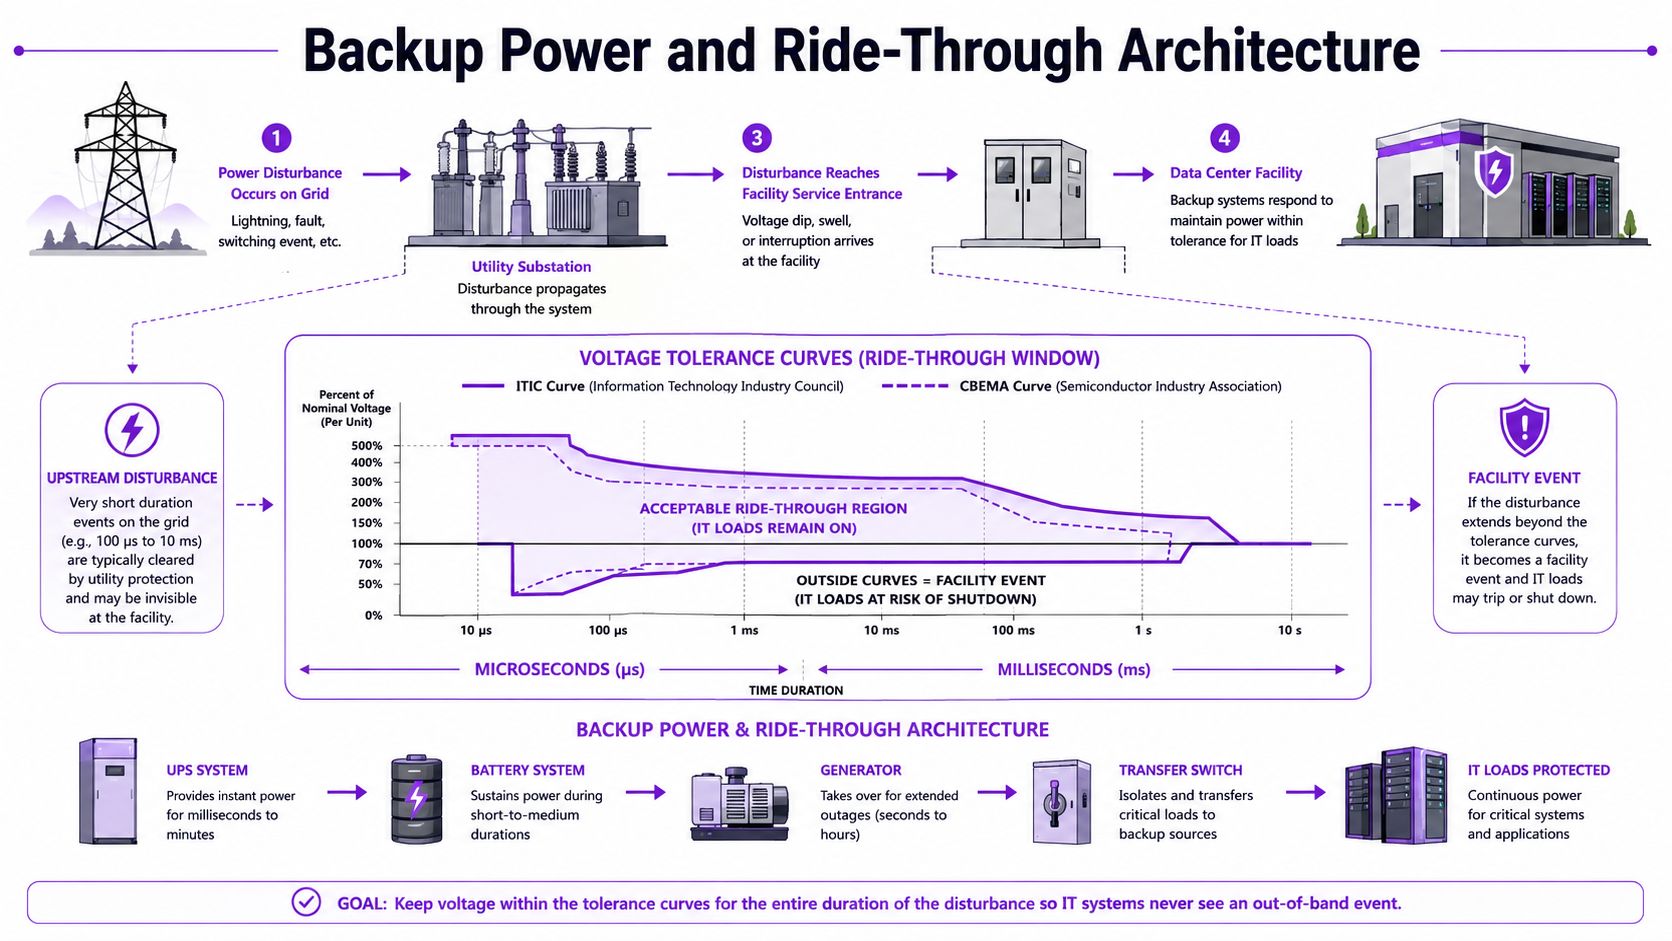
Backup architecture begins at the load interface, not at the generator yard. An upstream voltage disturbance can disconnect sensitive IT equipment before a full outage develops, so the UPS must stabilize power while the facility controls determine whether the utility feed can remain in service or backup generation must take over.
A technical report from the National Renewable Energy Laboratory describes AC UPS systems as equipment designed to ride through very short grid disturbances and transfer to backup when voltage excursions exceed IEEE and ITIC tolerance limits. The report cites a 30% voltage dip lasting longer than 20 milliseconds as a representative CBEMA/ITIC threshold, which illustrates why milliseconds-scale control coordination matters more than average annual grid reliability. (NLR technical report on edge data center power)
The sequence from disturbance to backup
The operating sequence typically has several stages:
- Detection: Protection and power-quality equipment identify a sag, interruption, or unstable condition.
- Ride-through: The UPS and battery system maintain the downstream waveform during the immediate event.
- Decision and start: Controls determine whether generators should start, while automatic transfer logic prepares the alternate source.
- Synchronization: Generator sets stabilize voltage and frequency before accepting the critical load.
- Load acceptance: The facility transfers in stages to prevent a sudden demand spike from destabilizing the generators.
The facility's power architecture must coordinate these stages with redundancy requirements, maintenance procedures, and generator fuel arrangements. A resilient design isn't defined only by the nameplate rating. It also depends on switchgear logic, battery state, fault clearing, generator paralleling, and the ability to test the system without exposing the IT load to unnecessary risk.
A data center profile such as the Deep Resilience Centre in Luxembourg is a useful reminder that resilience is a facility attribute, not merely a fuel choice. Diesel, natural gas, batteries, and flywheels each have different start characteristics, storage requirements, emissions profiles, and supply risks.
Design implication: Backup assets may run infrequently, but they must be maintained in a state that supports immediate operation. Readiness, not annual runtime, drives much of the engineering requirement.
Cooling Efficiency and Its Link to Power Sourcing
Cooling efficiency changes the upstream power problem. Lawrence Berkeley National Laboratory identifies 0.8 kW per ton as a good-practice benchmark and 0.6 kW per ton as a better-practice benchmark for data center cooling infrastructure. Those benchmarks connect thermal design directly to utility service, generator sizing, UPS capacity, and fuel requirements. (LBNL cooling infrastructure benchmarking guidance)
A facility that lowers cooling power intensity creates electrical headroom for IT equipment without increasing the external supply by the same amount. The benefit reaches beyond the monthly energy bill. Lower cooling demand can reduce transformer loading, standby generation requirements, battery capacity, and the amount of fuel needed during an extended grid event.
Climate is part of the power strategy
Air-side economizers and other forms of free cooling work differently across climates. A colder site may have more opportunities to reject heat without compressor-intensive cooling, while a hot or humid site may need more mechanical support. Water availability also matters when operators consider cooling towers, evaporative systems, or heat-recovery arrangements.
That relationship can influence site selection in a way that procurement teams often miss. A location with a favorable renewable-heavy grid may still need careful thermal engineering if ambient conditions increase cooling demand. Conversely, a site with less attractive grid attributes may reduce its total facility power requirement through a strong cooling design. Carbon analysis should therefore evaluate both the electricity source and the amount of electricity the thermal plant consumes.
| Cooling Design | Cooling Load | Utility Capacity Needed | Generator Capacity | Diesel Storage |
|---|---|---|---|---|
| 0.8 kW/ton benchmark | Higher cooling demand | Larger service requirement | Larger standby requirement | Greater fuel requirement |
| 0.6 kW/ton benchmark | Lower cooling demand | Lower service requirement | Lower standby requirement | Lower fuel requirement |
The table expresses the direction of the cascade rather than an invented project calculation. Actual values depend on IT load, redundancy configuration, climate, cooling technology, operating temperatures, and the facility's load-growth plan.
Analyst's conclusion: Power sourcing and cooling shouldn't be modeled as separate workstreams. Every avoided watt in the cooling plant changes the scale of the power system that must be procured, distributed, and backed up.
Carbon Accounting and the Limits of Green Claims
A renewable contract can reduce financial exposure and provide recognized environmental attributes while the facility remains physically connected to a carbon-intensive grid. That outcome reflects the difference between location-based and market-based Scope 2 accounting.
Location-based accounting applies an emissions factor associated with the regional electricity system. It describes the grid serving the facility. Market-based accounting uses contractual instruments, including renewable certificates, green tariffs, or qualifying power purchase agreements, to represent attributes acquired by the buyer. These methods answer different questions, so a single headline figure can conceal the distinction.
Why annual claims can obscure hourly reality
A data center connected to a gas-weighted regional system may receive electricity generated by gas, nuclear, coal, wind, solar, or other resources as conditions and dispatch change. A wind PPA can transfer contractual renewable attributes and settle financially, but it does not route wind-generated electrons to the facility in every hour.
The IEA's global and U.S. fuel-mix figures illustrate the same issue at larger scale. Data center electricity supply remains mixed globally, while the United States continues to rely heavily on natural gas alongside significant wind and solar generation. The accounting result depends on the disclosure method and on whether the buyer retires relevant certificates without overlap. The source data are discussed in the IEA energy supply data for data centers.
| Dimension | Location-Based | Market-Based |
|---|---|---|
| Primary question | What grid serves the facility? | Which contractual attributes did the buyer acquire? |
| Main input | Regional electricity emissions factor | Certificates, tariffs, or contractual instruments |
| Physical electricity | Reflects local system conditions | Does not necessarily change delivered electrons |
| Key review issue | Regional generation and dispatch | Ownership, retirement, vintage, and eligibility |
A more credible screening test
Operators should test whether a procurement claim demonstrates additionality, whether the project and facility have a meaningful regional relationship, and whether certificate vintage matches the consumption period. They should also check for double counting across the facility disclosure, utility program, and corporate PPA.
A credible claim states the matching window, documents certificate retirement, identifies third-party verification, and presents a location-based view beside the market-based result. Annual matching can support an initial portfolio assessment. Hourly matching sets a stricter standard because it tests whether procurement follows consumption as demand and grid conditions change.
The issue is not whether RECs or PPAs have value. They can support new generation, hedge prices, and provide recognized accounting attributes. The review question is narrower: does the claim describe facility-level physical emissions, contractual emissions, or both?
Carbon reporting therefore requires more than labeling a contract as renewable. Analysts must separate the electrons delivered through the regional system from the attributes assigned through procurement, then assess how each is reflected in the facility's reported emissions.
A Practical Checklist for Operators and Site Selectors
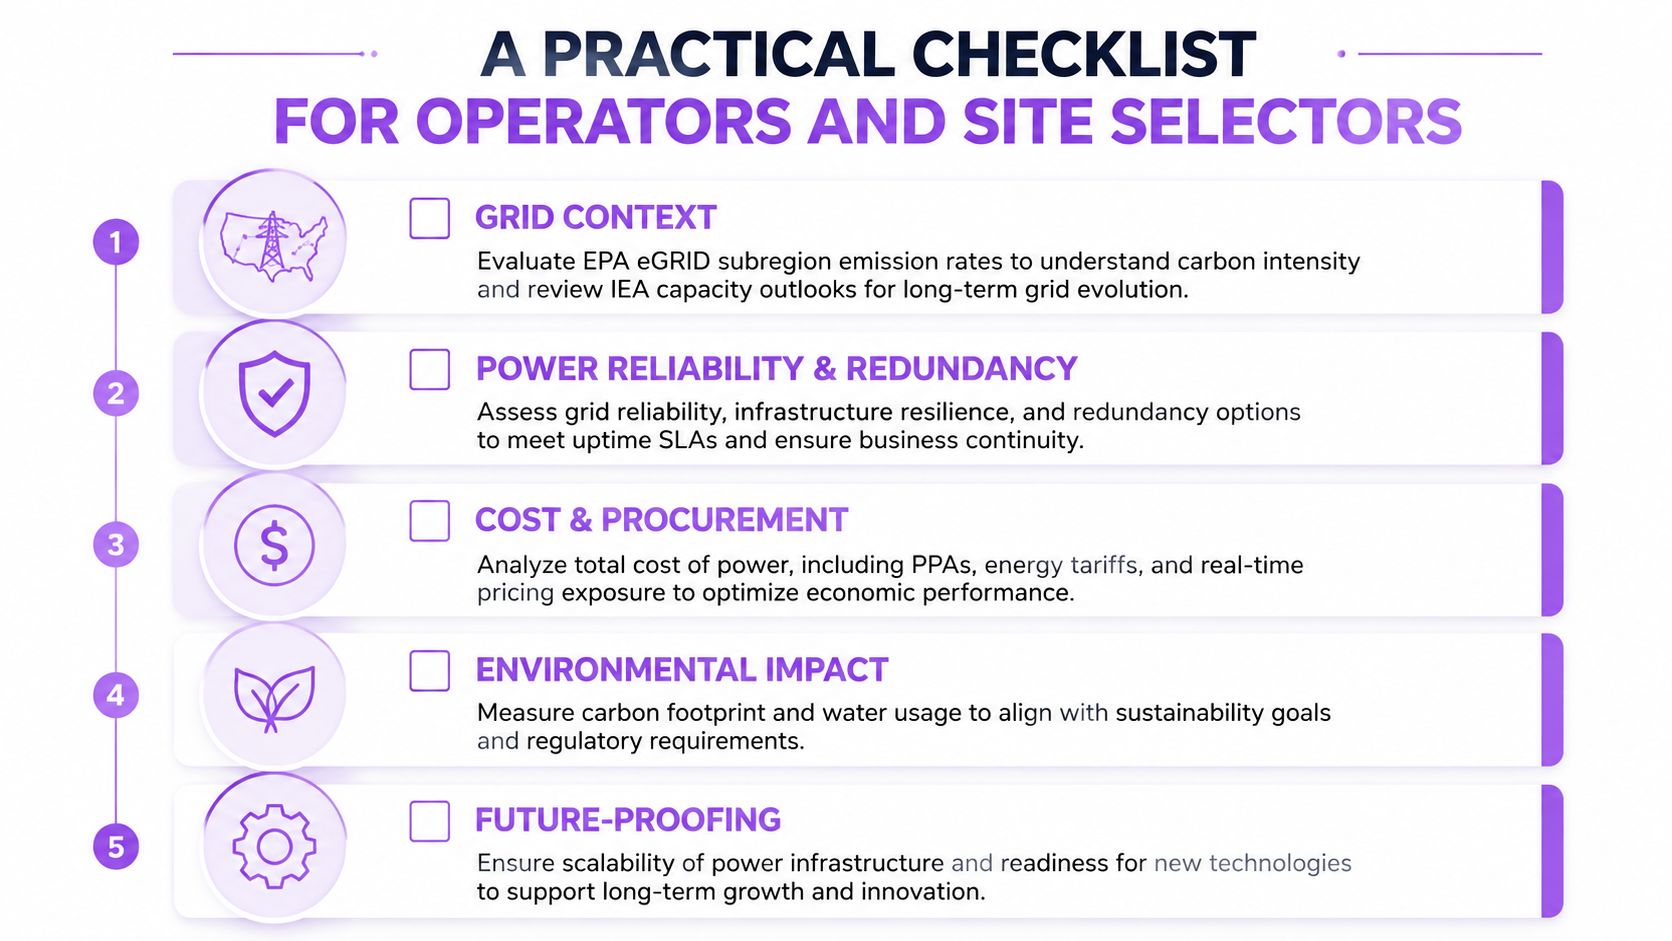
Power-source analysis becomes more reliable when every candidate facility passes the same five decision layers. The process should combine public grid data, facility disclosures, interconnection records, procurement documents, and accounting history rather than relying on a single sustainability statement.
Five layers for screening
Grid context comes first. Record the regional grid area, generation profile, transmission constraints, and expected capacity additions. A facility's physical carbon exposure begins with the system that serves its meter.
Test procurement fit. Identify whether the buyer uses a utility tariff, physical PPA, virtual PPA, green tariff, or direct-wire arrangement. Record the counterparty, delivery region, contract vintage, settlement structure, certificate ownership, and matching period.
Score onsite potential against constraints. Review available land and roof area, solar potential, fuel-cell or CHP feasibility, water availability, permitting conditions, and interconnection headroom. An onsite asset should be assessed for its actual contribution to load, not just its nameplate capacity.
Verify resilience sizing. Examine UPS ride-through capability, transfer logic, generator redundancy, fuel type, maintenance arrangements, and the facility's ability to operate through a prolonged utility interruption. The CBEMA and ITIC framework is particularly relevant because short voltage events can become load events before generators are ready.
Audit accounting discipline. Require dual Scope 2 disclosure where available. Check whether renewable certificates are retired for the same consumption period, whether claims are independently verified, and whether the buyer reports location-based emissions alongside market-based results.
A facility record should expose enough context for an analyst to identify missing information. Useful fields include eGRID region, disclosed or estimated IT power, operational status, generator nameplate and fuel type, interconnection position, PPA counterparty and vintage, and Scope 2 disclosure history. Data Centers List provides a searchable directory and map with facility locations, operators, status labels, and power-capacity fields that are disclosed or identified as AI-estimated, allowing market and pipeline comparisons without treating estimates as disclosed facts.
Decision standard: A site should not receive a clean-power label until its physical grid, contracted attributes, onsite generation, backup fuel, and accounting method have been reviewed together.
The most useful comparison is often between facilities in the same market. Analysts can separate active, planned, and under-construction projects, compare estimated and disclosed capacity, inspect water-stress context, and then return to the five layers above. That approach reveals whether a development's sustainability claim rests on new supply, certificate procurement, efficient cooling, firm low-carbon generation, or a combination that still depends heavily on the regional grid.
Data Centers List gives operators, developers, site selectors, and infrastructure analysts a searchable view of global facilities, including operating status, location, operator, and disclosed or AI-estimated power capacity. Visit Data Centers List to compare markets, review planned capacity, and add facility context to power sourcing and resilience decisions.