Data Center Power Distribution Architectures Explained
Master data center power distribution from utility feed to rack. Explore UPS topologies, PDU strategies, redundancy models, and AI-era design shifts.
15 min read
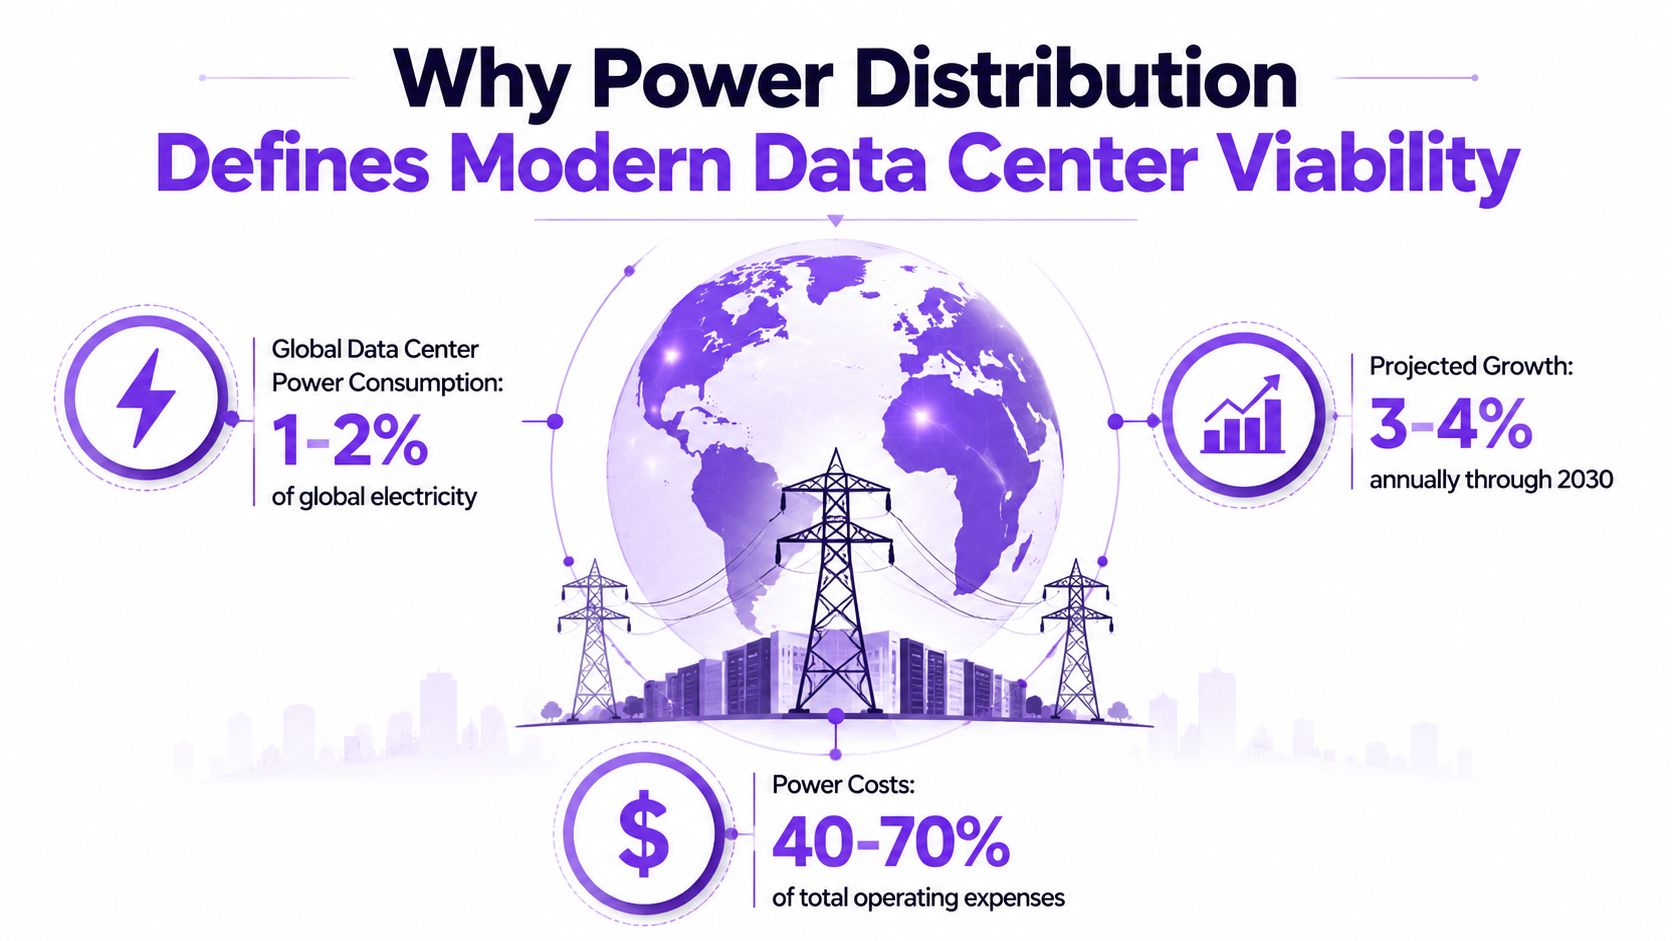
Global data center electricity consumption reached about 415 TWh in 2024, or roughly 1.5% of the world's electricity use. The International Energy Agency projects that figure will more than double to about 945 TWh by 2030, just under 3% of global consumption. (IEA analysis of data center energy models)
That trajectory changes the meaning of data center power distribution. Electrical architecture no longer sits behind the IT design as a supporting utility. It determines where a facility can be built, how quickly it can expand, how much power reaches the compute load, and whether an AI cluster can operate without making the grid connection itself the limiting asset.
Table of Contents
- Why Power Distribution Defines Modern Data Center Viability
- Tracing the Power Path from Grid to Rack
- Redundancy Topologies and Their Real-World Trade-Offs
- When Conventional Distribution Stops Scaling for AI Densities
- Designing Distribution Around Grid Constraints and Onsite Power
- Monitoring and Efficiency Practices That Reduce Distribution Losses
- Planning Distribution Architectures for the Next Decade of Growth
Why Power Distribution Defines Modern Data Center Viability
The United States accounted for 45% of global data center electricity demand in 2024, compared with 25% for China and 15% for Europe, according to the IEA assessment cited earlier. Those shares make electrical access a development constraint, not a background utility decision. Land and fiber establish a site's potential, but the project depends on an electrical path that can secure, transform, protect, and deliver its planned load.
The electrical path is a chain of decisions
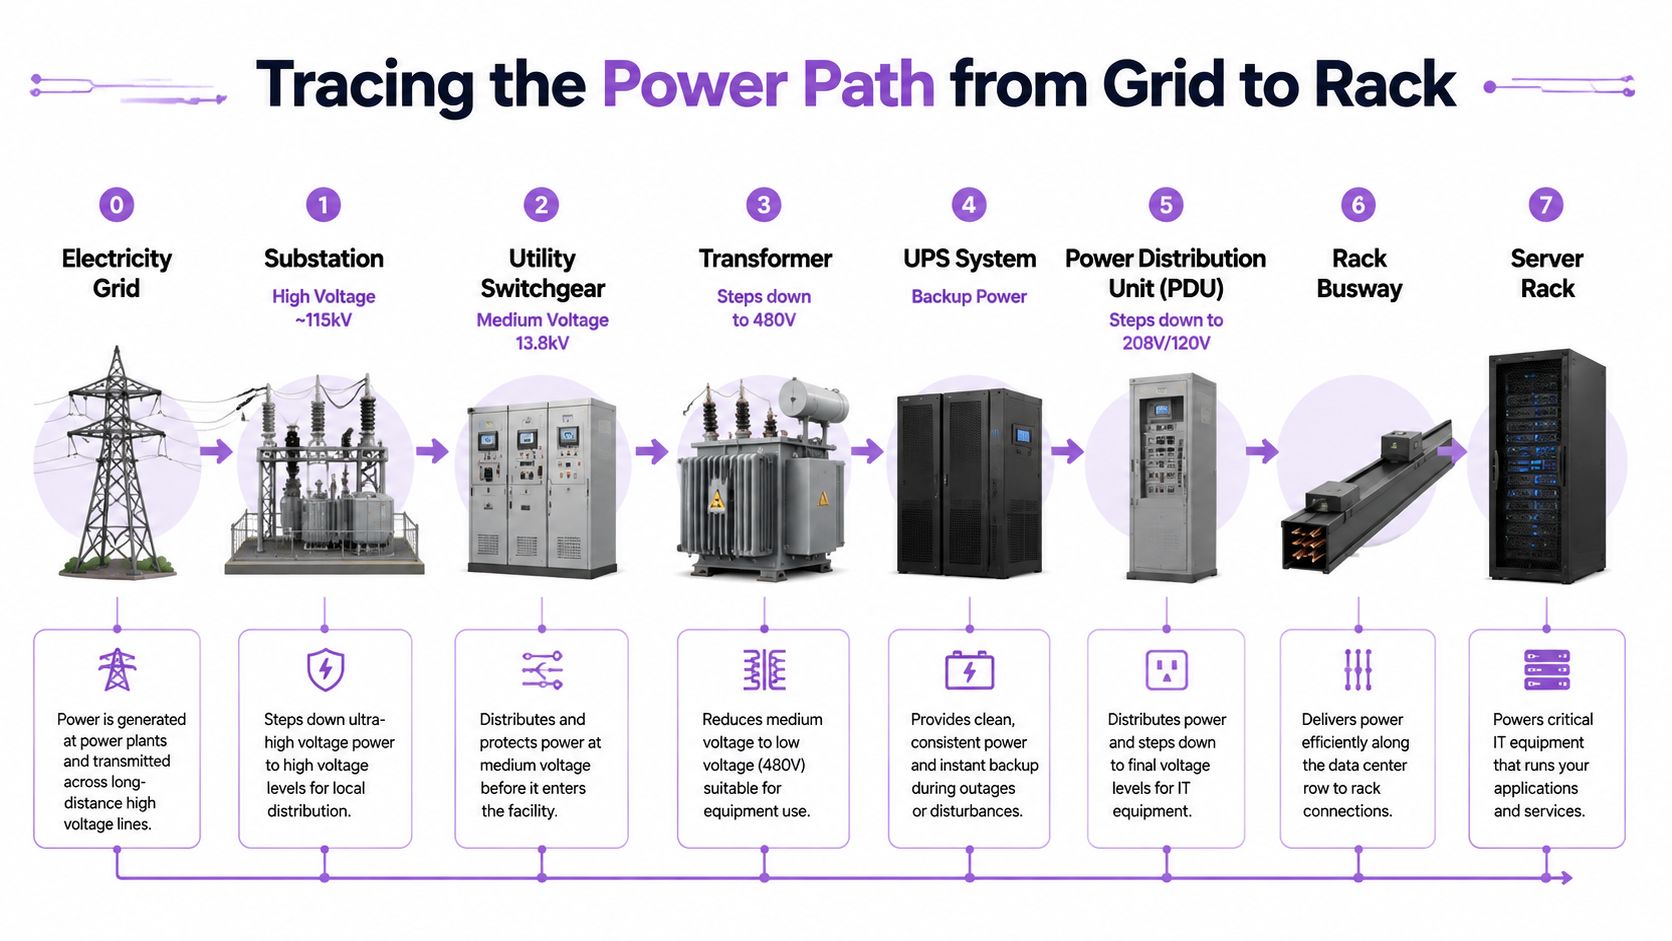
A facility typically begins at a utility interconnection. Medium-voltage service enters switchgear, moves through protection and isolation equipment, and reaches transformers that establish the voltage used inside the building. Power can then pass through switchboards and UPS systems before reaching distribution units, busways, branch circuits, and rack-level power distribution units.
Each stage serves a distinct purpose:
- Interconnection and switchgear define the boundary between utility service and facility equipment, while providing fault protection and isolation.
- Transformers adjust voltage for internal delivery, but add conversion losses, heat, maintenance requirements, and space constraints.
- UPS systems condition power and provide ride-through capability during disturbances or transfers to backup sources.
- PDUs and busways allocate capacity across rooms, pods, rows, and racks while allowing operators to isolate faults.
- Rack-level PDUs deliver power to servers and provide operating data for load balancing, capacity planning, and fault detection.
The design must balance resilience with electrical efficiency. Redundancy adds failure tolerance, maintenance options, and isolation points. It can also lengthen the power path, increase conversion stages, complicate controls, and create more opportunities for configuration errors.
Efficiency now affects buildability
Data center electricity use surged 17% in 2025, while global electricity demand grew 3%, according to the IEA's report on 2025 electricity use. (IEA report on 2025 data center electricity use) The gap shows why distribution planning increasingly follows grid constraints. Transmission upgrades and interconnection processes may not expand at the same pace as AI and HPC demand, leaving available utility capacity as the limiting asset.
Practical rule: Judge a distribution design by delivered compute capacity, not only by the size of its utility service.
The investment question has shifted accordingly. Operators must measure how much contracted power reaches the IT load, how the architecture responds to sudden density increases, and whether the facility can keep operating when the utility cannot support the planned expansion. Traditional low-voltage distribution may remain suitable for conventional racks, but AI densities can push conductors, busways, switchgear, cooling interfaces, and conversion stages beyond their practical scaling limits. At that inflection point, the architecture must be redesigned around grid availability and delivered power, rather than selected only by redundancy tier.
Tracing the Power Path from Grid to Rack
The power path is a sequence of voltage changes, protection points, and operating decisions. Reading it this way exposes where a design loses efficiency, limits maintenance, or stops scaling as AI and HPC rack densities rise.
From utility service to conditioned power
The utility feed enters at a utility-controlled voltage. Incoming switchgear measures the service, interrupts faults, and provides isolation for maintenance. Its design must account for fault current, selective coordination, access requirements, and the effect of losing an incoming path. These constraints are set at the site boundary, before the facility's redundancy architecture can provide protection.
Transformers reduce incoming voltage for internal distribution. Their ratings and placement affect conductor sizes, room area, heat removal, and the number of later conversion stages. Each additional voltage change introduces equipment and potential losses. For conventional loads, familiar low-voltage boundaries may remain practical. AI and HPC loads can make those boundaries restrictive because higher current increases conductor, busway, switchgear, and thermal demands.
The UPS system follows the initial transformation and distribution equipment. A double-conversion UPS rectifies incoming AC to DC, then inverts it to AC, maintaining conditioned output and supporting ride-through through batteries. A line-interactive design uses a different control method and can reduce conversion activity during normal operation. Modular UPS systems divide capacity into blocks, allowing expansion or replacement without relying on one large installation.
UPS selection therefore affects more than backup duration. Topology changes conversion efficiency, maintenance procedures, fault containment, battery integration, and the transition among utility power, stored energy, and generators. The right choice depends on how those functions interact with the facility's load profile and grid limitations.
From switchboards to the rack
Downstream of the UPS, switchboards and PDUs distribute conditioned power to rooms, pods, or rows. A PDU can combine transformers, protective devices, monitoring, and branch-circuit distribution. Traditional layouts often reduce voltage again before power reaches IT equipment, adding another conversion point and another limit on current-carrying capacity.
Busway provides a more modular alternative to fixed branch cabling. Taps can be placed along a row, allowing rack connections to move or expand without rebuilding the full distribution run. That flexibility matters when rack populations change, especially where operators must support different densities within one hall.
At the final stage, a rack PDU feeds server power supplies and measures rack load. Its readings can expose phase imbalance, unexpected current growth, or an approach to assigned capacity. It cannot repair an upstream architectural weakness, but it can identify deteriorating headroom before an overload becomes an outage.
The full chain reveals the scaling problem. Every transformation and switching point trades protection and maintainability against voltage suitability, efficiency, and space. A shorter path is not automatically safer, while added equipment does not by itself solve a grid-capacity constraint. Operators must coordinate the electrical path with the power available at the site and the density the rack requires.
Redundancy Topologies and Their Real-World Trade-Offs
Redundancy is useful only when it addresses the failures a facility can isolate and recover from. Separate power paths may appear independent on a one-line diagram, yet shared switchgear, controls, cooling dependencies, breaker states, or operating mistakes can still remove both paths at once. The topology therefore describes a starting condition, not the resilience an operator has demonstrated.
Comparing the main architectures
| Topology | Capital Cost Premium | Typical Availability | Maintenance Flexibility | Best Fit |
|---|---|---|---|---|
| N | Lowest | Dependent on the single installed path | Limited | Workloads with tolerance for planned interruption |
| N+1 | Moderate | Protects against a defined component failure | Better, if the spare is available and isolated | General enterprise and mixed workloads |
| 2N | High | Separate capacity paths can support concurrent path loss | Strong, provided paths are genuinely independent | Critical workloads requiring active path maintenance |
| 2(N+1) | Very high | Multiple independent paths with spare components | Highest equipment-level flexibility | Highly critical, continuously operating environments |
| Distributed or catch-up redundancy | Variable | Depends on controls, load behavior, and recovery design | Can be flexible during staged maintenance | Modular AI and HPC deployments with controlled workload behavior |
N installs only the capacity required by the present load. A transformer, UPS module, or distribution segment failure can interrupt the connected equipment unless another system outside the nominal design responds.
N+1 adds a spare component for a defined failure or maintenance event. It does not cover a shared bus, common control system, or procedural error. The reserve must also be available, isolated, and tested under realistic loading. A spare that cannot assume the load provides little practical protection.
2N duplicates the complete capacity path. Equipment with two feeds can continue operating while one path is removed for maintenance or lost through failure. The value depends on physical and operational separation. A shared switchboard section, control circuit, cooling dependency, or switching procedure can make nominally separate paths fail together.
2(N+1) combines two paths with spare components inside each path. This provides the widest equipment-level maintenance margin, but it also increases commissioning work, testing requirements, operating complexity, and capital exposure. That premium makes sense only when the workload's continuity requirements and revenue exposure support it.
Distributed or catch-up architectures use modular power blocks alongside workload controls. If a failure temporarily reduces available capacity, operators can pause, reschedule, or throttle selected jobs rather than maintain full spare capacity for every condition. This approach fits some AI and HPC operations, but only where orchestration, recovery targets, and service-level agreements are explicit.
Redundancy is an operating discipline, not merely an equipment count.
A practical evaluation asks how much compute capacity remains available during a component failure, maintenance event, or switching error. For investors, evidence includes documented procedures, isolation records, commissioning results, and failure tests. For operators, the question is whether those controls protect the actual workload and its recovery requirements, rather than only satisfy a topology label. At high AI densities, that distinction also determines whether added redundancy preserves usable capacity or consumes electrical headroom that the site cannot obtain from the grid.
When Conventional Distribution Stops Scaling for AI Densities
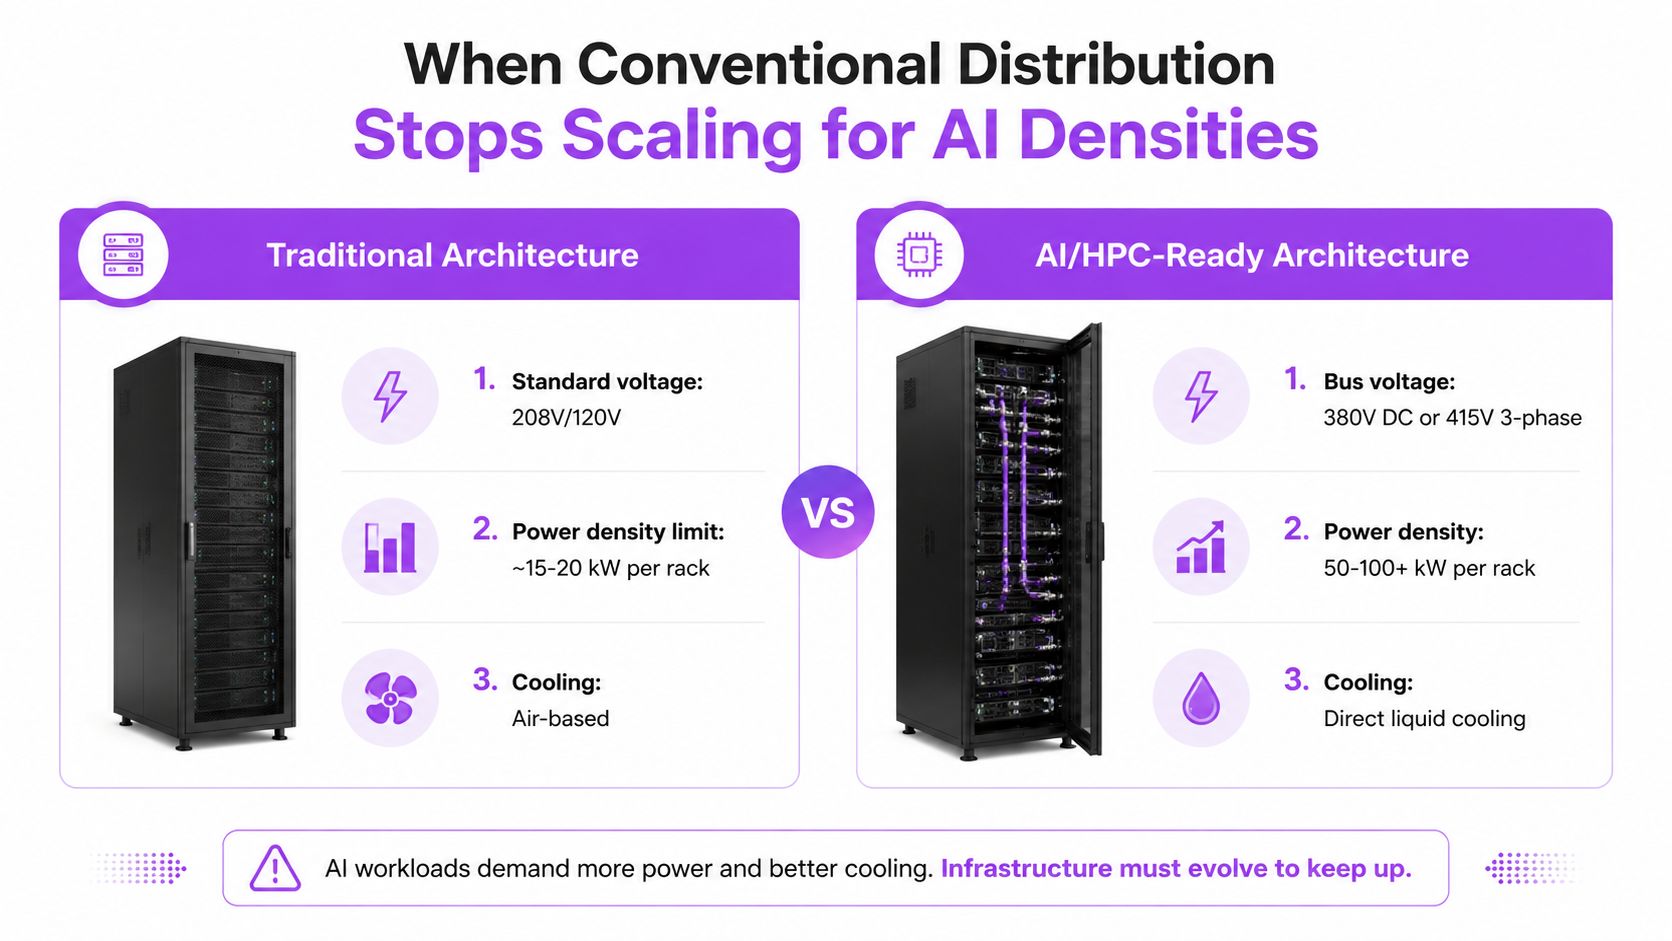
Traditional low-voltage distribution works well while rack loads remain within the assumptions built into the electrical room, busway, conductors, cooling system, and branch protection. AI and HPC deployments challenge those assumptions simultaneously.
Recent industry reporting describes rack densities at 300 kW per rack and above as a point where conventional 240V single-phase delivery becomes difficult. (IEA report on data center bottlenecks and AI loads) At that scale, the problem isn't solved by placing more ordinary rack PDUs beside the enclosure. Current rises sharply for a given power level as voltage falls, increasing conductor requirements, resistive losses, thermal stress, and the physical burden of connection hardware.
Why higher voltage changes the design
Moving from traditional 208V-style distribution toward 400V or 415V three-phase delivery reduces downstream transformation stages and lowers current for a given kilowatt load. Industry white papers report approximately 2% to 3% energy-cost savings versus 208V distribution and about 4% to 5% versus 120V distribution. (415V power distribution efficiency white paper)
A 415V four-wire system can deliver 240V single-phase power to racks with fewer conversion steps. The architecture therefore preserves compatibility with rack equipment while improving the upstream delivery path. Lower current can reduce copper requirements and simplify the physical route through busways, panels, and connectors.
The benefit is architectural, not cosmetic. A higher-voltage system can give an operator more usable capacity within the same pathway and reduce the amount of electrical equipment competing for limited white-space and service-room area.
The next pivot may happen above low voltage
At the upper end of density, operators are considering medium-voltage blocks, modular pod-level distribution, and specialized DC clusters. Each option changes protection, arc-flash management, conversion placement, service procedures, and equipment compatibility. The decision can't be made from efficiency alone.
Higher-voltage DC architectures can remove additional conversions, but they introduce their own requirements for switching, isolation, protection, commissioning, and workforce training. The result is a design debate about where conversion should occur, not just whether AC or DC is superior.
Facilities planned for AI workloads therefore need a density envelope rather than a single rack rating. A project that appears adequate for ordinary enterprise equipment may become constrained by busway capacity, transformer placement, cooling interfaces, or maintenance clearances before the utility service reaches its nameplate limit. Operators evaluating a high-density campus can review facility context and disclosed or estimated capacity through the Hut 8 River Bend AI Data Center Campus profile, while keeping the electrical architecture itself as a separate due diligence question.
Designing Distribution Around Grid Constraints and Onsite Power
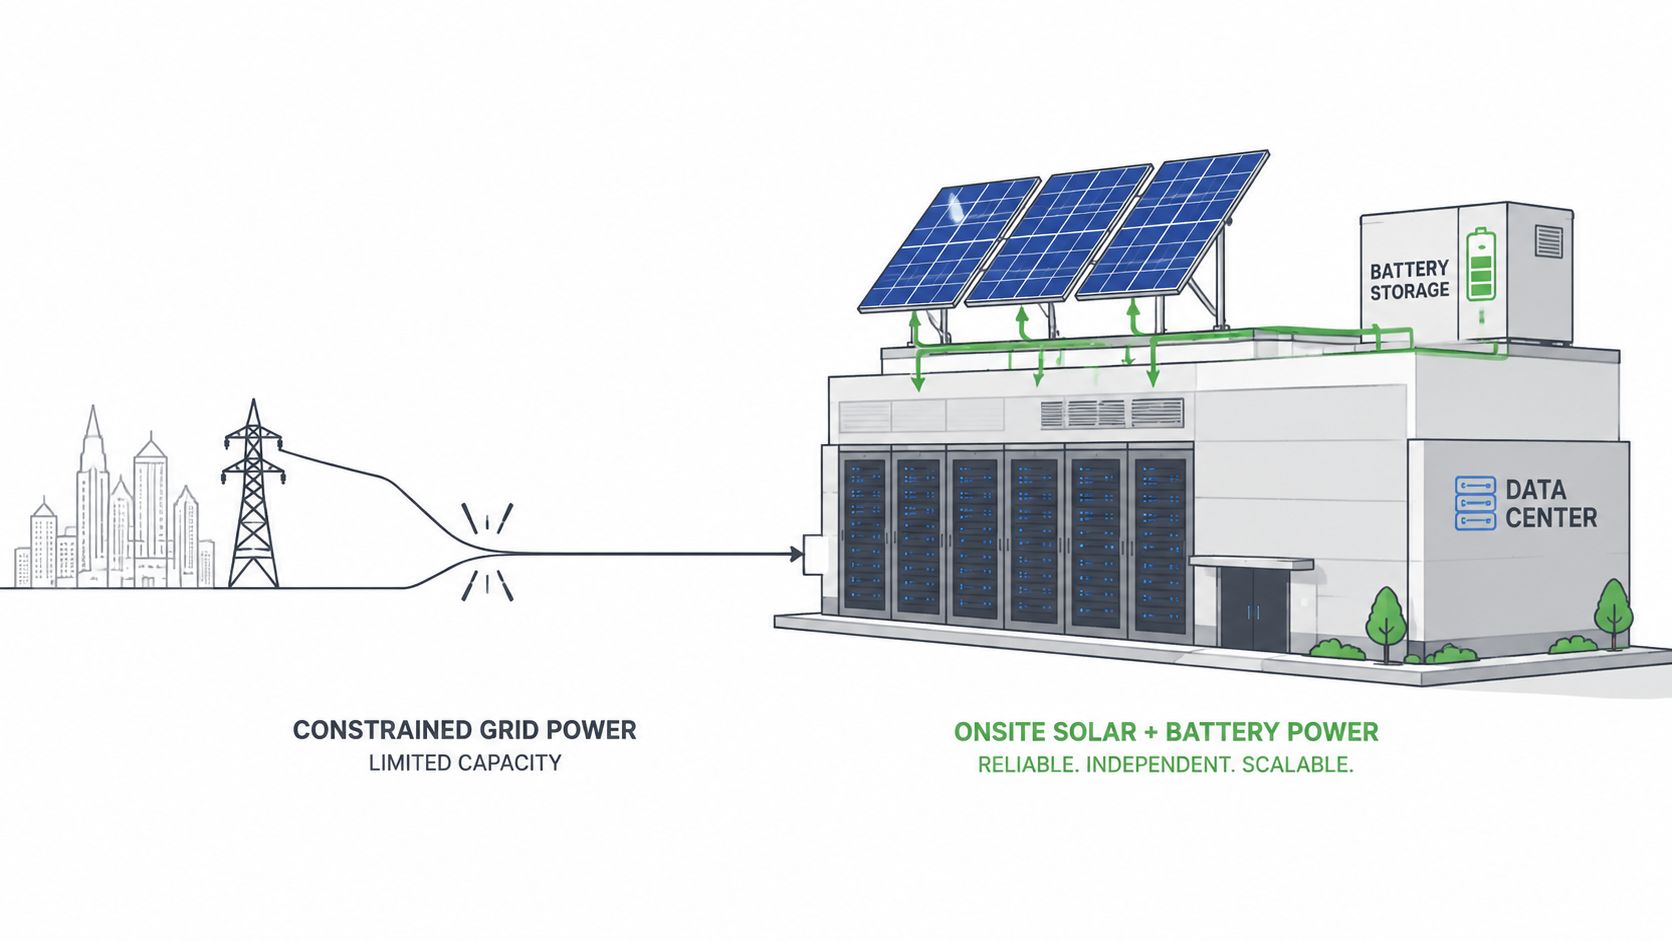
The traditional sequence begins with a utility service, then builds internal distribution around the available connection. That model breaks when the grid cannot deliver the requested capacity on the required schedule. For AI and HPC campuses, the first electrical decision is increasingly how to assemble power, followed by how to distribute it.
Independent reporting indicates that more than 30% of announced data centers will include some portion of onsite power, while one survey found that providers for fully onsite-powered data centers increased by 22%. (ABB reporting on onsite data center power) These figures point to a change in sequencing. Developers must assess generation, storage, interconnection limits, and operating permissions before fixing the distribution architecture.
Hybrid systems change the one-way power model
Onsite generation may include gas turbines, fuel cells, and other generation assets. Battery energy storage can support transfers, manage short disturbances, and help the facility respond to grid conditions. Small modular reactors remain a longer-horizon option under discussion, with regulatory, safety, siting, and commercial questions still unresolved.
The distribution system must coordinate these sources instead of treating them as a simple backup chain. Transfer equipment must distinguish grid-connected operation from islanded operation. Controls must manage synchronization, load shedding, black-start requirements, battery state, and the priority assigned to critical and interruptible loads.
Hybrid facilities may also experience bidirectional power flow. Storage can charge from the grid or onsite generation and discharge into the facility or grid-facing connection, subject to interconnection rules. Protection settings, metering, and control sequences therefore become more demanding than in a one-way utility-to-rack design.
Availability now includes the power source
A site with strong internal redundancy may still miss its expansion plan if the external interconnection remains constrained. Industry forecasts place U.S. data center demand at 75.8 GW in 2026 and 134.4 GW by 2030. These projections reinforce why transmission bottlenecks, local generation, and demand-response obligations belong in the same investment model as UPS capacity and busway design.
That changes the availability question. Operators must determine whether the facility can assemble a reliable, compliant power portfolio, then distribute it across changing workloads without creating instability at the grid interface. For high-density AI campuses, grid access and electrical topology are now coupled design constraints, not separate planning exercises.
Monitoring and Efficiency Practices That Reduce Distribution Losses
Electrical distribution losses can account for about 10% to 12% of total facility energy use on average. (Power distribution efficiency analysis) That scale justifies continuous measurement from the utility service through the rack, particularly as AI and HPC loads make low-voltage paths harder to scale efficiently.
Measure the path at useful boundaries
Compare utility input, UPS output, room distribution, and rack consumption. Rack-level PDUs connect facility readings to individual enclosures, allowing operators to identify where energy disappears and whether assigned capacity matches actual use. These measurements also support PUE calculations and fault detection when rack totals are reconciled with whole-building consumption.
A useful monitoring program includes:
- Rack-level load visibility: Identify phase imbalance, unexpected growth, and unused reserved capacity before adding equipment.
- Branch-circuit comparison: Reconcile panel readings with downstream rack measurements to locate unexplained losses or metering gaps.
- Power-quality review: Track voltage behavior, harmonics, transients, and power factor so engineers can investigate electrical stress before equipment damage.
- UPS loading analysis: Compare loading patterns across modules and paths instead of relying on nameplate capacity alone.
- Thermal correlation: Relate electrical changes to room and rack temperatures, especially where liquid-cooled and mixed-density pods operate together.
Convert readings into design decisions
Monitoring has value only when it changes operating or investment decisions. A rack that consistently remains below its reserved capacity may not need the same distribution block as one exposed to synchronized AI demand. Low average utilization can also conceal short peaks that stress protection and cooling equipment.
Operating discipline: Capacity planning should use measured load profiles, peak behavior, and fault history, not nameplate ratings in isolation.
Measurement should feed maintenance priorities, busway planning, and future voltage decisions. Persistent imbalance may justify circuit changes, while recurring peaks can indicate that conventional low-voltage distribution is approaching its practical limit.
Facility comparisons need context. A directory profile such as the Syracuse University Green Data Center can establish location and facility context, but engineers still need primary design records, interval data, commissioning results, and operating logs to validate distribution performance.
Planning Distribution Architectures for the Next Decade of Growth
A durable power architecture begins with scenarios, not an equipment list. Test rapid AI workload migration, delayed utility expansion, islanded operation, and changing proportions of high-density pods and conventional enterprise halls.
Three choices shape the design:
- Voltage strategy: Identify where higher-voltage AC or DC delivery can remove conversion stages without creating unacceptable protection or service complexity.
- Modularity: Use pod-level blocks when workload timing is uncertain and incremental deployment matters more than maximum initial scale.
- Grid posture: Determine whether onsite generation, storage, or demand-response capability is required when utility supply limits expansion.
The planning horizon should include serviceability. As rack density rises, distribution paths may need higher voltage, shorter runs, or dedicated liquid-cooled pods rather than repeated expansion of conventional low-voltage infrastructure. A modular design can also separate commissioning schedules and reduce the need to energize unused capacity.
Investors should examine the gap between contracted utility capacity and usable IT capacity, the independence of redundant paths, the evidence supporting rack-density assumptions, and the controls for hybrid operation. A planned project such as Applied Digital Project Lightning warrants review of its interconnection, phasing, distribution topology, and workload fit, not just its announced capacity.
The strongest design is the one that remains serviceable as density rises, adapts when supply conditions change, and provides measurement from the utility boundary to the rack. Data Centers List offers a searchable directory and map of operational, planned, and under-construction facilities, including location, operator, status, and disclosed or AI-estimated IT power capacity. Data Centers List can provide facility and market context for evaluating expansion risk and site-level investment opportunities.