Data Center Equipment List: 10 Essential Systems in 2026
Explore a data center equipment list covering 10 essential systems, their roles, and key implementation trade-offs.
23 min read
A reported megawatt figure doesn't tell the whole data center story. It may describe IT power capacity, total electrical service, a planned phase, or an estimate inferred from comparable facilities. Without the equipment behind that figure, a reader can't tell whether a site has the compute, power delivery, cooling, connectivity, protection, and monitoring needed to support it.
A useful data center equipment list therefore works as a capacity test, not a shopping checklist. Disclosed server specifications, UPS configuration, generator capacity, cooling architecture, and PDU telemetry can support a published capacity claim. If those details are absent, a capacity label should remain clearly separated as AI-estimated, rather than treated as an operator disclosure.
Data Centers List provides a practical comparison layer for that work. Its searchable global directory and sortable table organize facilities by status, location, operator, and IT power capacity, while profiles distinguish disclosed values from AI-estimated figures. Map overlays, rankings, operator views, and pipeline visibility help analysts test whether a facility's equipment profile fits its reported or estimated scale.
Table of Contents
- 1. Servers and Computing Hardware
- 2. Power Distribution Units
- 3. Uninterruptible Power Supplies
- 4. Cooling and Climate Control Systems
- 5. Electrical Infrastructure and Backup Generators
- 6. Network Infrastructure and Interconnection Equipment
- 7. Storage Systems and Data Protection
- 8. Environmental Monitoring and Building Management Systems
- 9. Security Systems and Physical Access Control
- 10. Modular and Prefabricated Data Center Solutions
- Top 10 Data Center Equipment Comparison
- Turn the Equipment List Into a Capacity Check
1. Servers and Computing Hardware
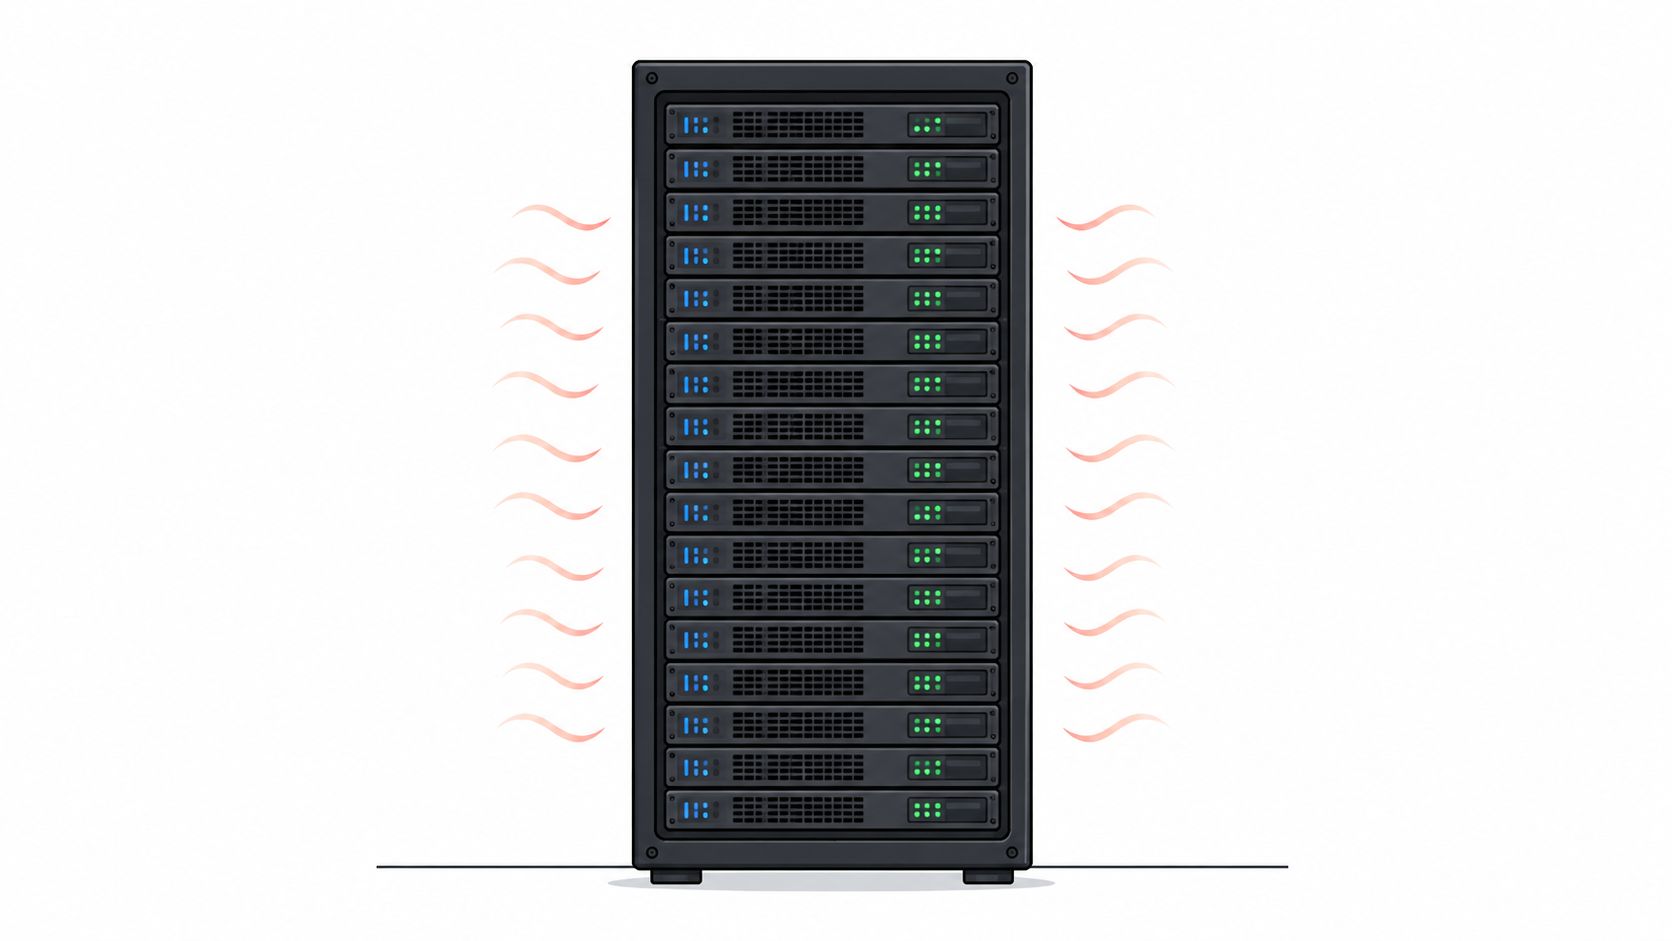
Servers do not convert every available megawatt into productive compute. They determine how much of a facility's electrical and thermal design can support usable workloads. Rack-mounted systems, blade servers, GPU platforms, memory, local drives, and custom accelerators serve cloud services, colocation tenants, enterprise applications, and high-performance computing. A data center hardware market breakdown from Straits Research identifies servers with CPUs and GPUs, memory chips, storage drives, routers, and switches as core components.
Server architecture also tests the credibility of a capacity estimate. An AI-ready facility should show evidence of dense accelerated computing, suitable power delivery, and cooling designed for higher heat output. A general-purpose enterprise site may use predominantly CPU systems and conventional rack layouts. Its estimated IT load therefore requires different assumptions.
What server evidence can reveal
A generic server count says little about capacity. CPU generation, accelerator type, memory configuration, rack density, and rated power determine how equipment relates to the site's electrical and cooling limits.
Useful checks include:
- Processor mix: Separate CPU-heavy environments from GPU or other accelerator deployments.
- Power ratings: Compare disclosed equipment ratings with stated IT power, while keeping nameplate power separate from measured operating load.
- Architecture changes: Track platform changes over time because newer processors can alter performance, density, and thermal requirements.
- Deployment phase: Separate planned server capacity from equipment installed at an active site.
Practical rule: A server disclosure supports an MW figure only when equipment profile, rack density, power delivery, and cooling design point in the same direction.
The distinction matters because servers represent the largest spending category in the available market breakdown. IT infrastructure accounted for 78% of data center spending in 2024, and servers represented 61% of IT infrastructure spending, according to IoT Analytics' data center infrastructure analysis. Compute is therefore the first equipment group to examine, not sufficient evidence by itself. Analysts can use Data Center List to compare facilities by status, location, operator, and capacity, then separate disclosed figures from AI-estimated capacity when server evidence is incomplete.
2. Power Distribution Units
Power distribution units, or PDUs, connect upstream electrical equipment to data center racks. Their physical role is straightforward: divide incoming power among servers and other IT devices. Their operational value depends on the controls and measurements attached to that distribution path. Metered models can report consumption by rack, circuit, or outlet, while switched models let operators control selected outlets remotely.
That distinction matters in different operating environments. Colocation operators can use outlet-level readings to assign tenant consumption and investigate billing differences. Hyperscale teams can compare rack loads, identify abnormal draw, and isolate a developing equipment problem before it affects availability. The PDU therefore provides an operational observation point, not merely a set of sockets.
What PDU readings can and cannot establish
PDU measurements sit closer to the IT load than a site-wide electrical statement. Analysts should keep three capacity signals separate:
- Facility electrical service: power available to the building or campus.
- IT power capacity: the portion intended for computing equipment.
- Observed rack load: consumption measured through distribution equipment.
These values often diverge without indicating an error. A facility may have electrical headroom for a later phase, capacity reserved for tenants, or installed distribution gear serving racks that remain partly empty. Metering can reveal those conditions more clearly than a general facility description.
PDU telemetry also helps test published figures and refine AI-estimated capacity. A site may disclose substantial IT power while current rack readings remain lower because utilization has not reached the designed limit. The reading supports a distinction between available capacity and operating load, but it does not by itself verify the entire electrical design, cooling system, or commissioning status.
Data Center List gives analysts a practical comparison layer for sorting facilities by status, location, operator, and capacity. PDU evidence can then be assessed against the facility's disclosed figures, while estimates remain clearly marked as estimates.
PDU telemetry is strongest as a reconciliation layer. It can refine an AI estimate, but it should not be treated as a complete facility audit.
Power density further complicates comparisons between sites. Benchmarking literature on data center power density reports measured computing loads ranging from about 20 W/ft² to 56 W/ft² in older facilities, with another multi-site effort spanning roughly 5 to nearly 100 W/ft². Comparable floor areas can therefore support different rack loads, making PDU readings useful when capacity comparisons rely on physical area alone.
3. Uninterruptible Power Supplies
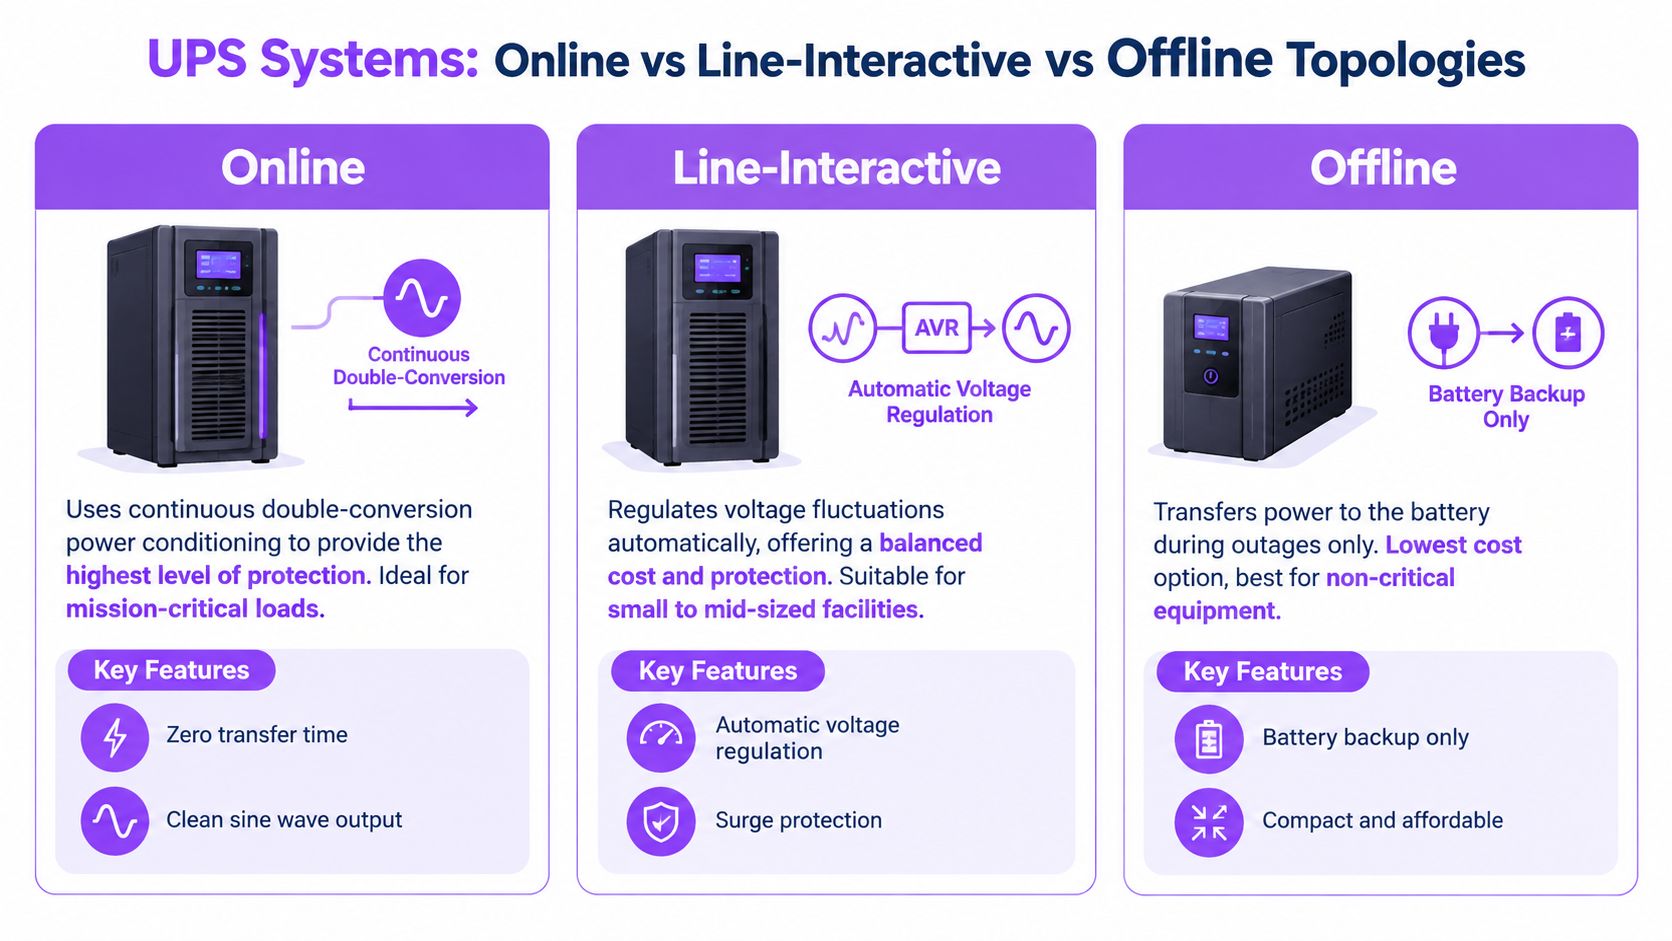
UPS systems keep critical equipment running during utility disturbances. Batteries and power electronics bridge the gap until generators start, or provide time for controlled failover and shutdown. Rack-level units can serve smaller deployments, while centralized UPS systems support larger electrical blocks.
The configuration matters more than the equipment label. Analysts should establish the supported load, modularity, redundancy arrangement, and battery monitoring status before using a UPS inventory to assess resilience. An N design, N+1 arrangement, or more fault-tolerant architecture can support different maintenance and failure scenarios. None, by itself, proves a formal tier classification.
A useful review begins with four checks:
- Supported load: Compare UPS output with stated IT power, rather than total building service.
- Redundancy path: Check whether module failure or maintenance reduces usable capacity.
- Battery technology: Record whether the system uses conventional or lithium-ion batteries. Avoid assumptions about lifecycle performance without operator data.
- Expansion position: Separate installed UPS blocks from reserved space and future plans.
Battery age can create operational risk even when nominal capacity appears adequate. Maintenance records and operator sustainability reports may show replacement activity. Missing records indicate uncertainty, not poor condition.
UPS capacity also provides a test for disclosed and AI-estimated capacity. If a facility profile reports substantial IT power but the visible UPS configuration appears materially smaller, the figure may refer to a future phase, a campus total, or an estimate built from incomplete public information. That mismatch should be recorded for follow-up, not treated as automatic disqualification.
Data Center List provides a comparison layer for sorting facilities by status, location, operator, and capacity. Analysts can compare UPS evidence with disclosed figures while keeping estimates clearly identified.
UPS evidence has limits. It can refine a capacity assessment, but it cannot verify the full electrical design, cooling arrangement, commissioning status, or current battery condition. Reliability claims therefore require equipment evidence and supporting operational documentation.
4. Cooling and Climate Control Systems
Cooling equipment determines whether installed electrical capacity can become usable IT capacity. Servers, power electronics, lighting, and facility systems all produce heat, while air handlers, chillers, pumps, heat exchangers, containment, and liquid-cooling loops remove or redirect it. Their configuration reflects rack density, climate, water availability, building design, and workload type.
CRAC and CRAH systems can support lower-density enterprise rooms and established colocation halls. AI-oriented deployments may require direct-to-chip liquid cooling, immersion, or a hybrid design when accelerator loads exceed practical air-cooling limits. Coverage of changing data center hardware requirements from Semtech on data center hardware trends identifies liquid cooling as part of the equipment shift around AI workloads.
Cooling evidence reveals implementation limits
A cool-climate facility may use economization or free cooling during part of its operating profile. A water-constrained site may choose recirculation, dry cooling, or liquid systems with different water requirements from evaporative designs. These decisions affect permitting, local scrutiny, expansion costs, and the confidence analysts can place in an AI-estimated capacity.
Location data adds necessary context. The Green Datacenter ZRH3 facility profile can help analysts compare a facility's status, location, operator, and capacity while checking whether its reported cooling approach fits local conditions. A map point alone cannot establish thermal suitability.
Review the equipment record for four signals:
- Thermal architecture: Identify air, liquid, immersion, or hybrid cooling.
- Density assumption: Compare cooling provision with verified rack requirements, not floor area alone.
- Water indicators: Check disclosed water use or WUE against local water-stress conditions.
- Expansion readiness: Separate installed chillers, heat rejection, pumps, and distribution loops from proposed equipment.
Cooling capacity should be tested against the same disclosure categories used for IT power. A facility may disclose current installed cooling, planned cooling, or a broader campus figure. If the thermal plant appears smaller than the reported IT allocation, record the mismatch as uncertainty rather than proof that the facility is misrepresented. Conversely, surplus installed cooling can signal expansion readiness without proving that servers are commissioned.
The data center infrastructure market analysis from Global Market Insights places cooling alongside power delivery and environmental monitoring as site-specific infrastructure considerations. Electrical service can therefore become stranded if heat rejection, water access, or distribution capacity cannot support the intended load.
For buildings with adjacent workplaces, teams can consult guidance on how to optimize HVAC airflow for comfort, while treating general comfort guidance separately from data center thermal engineering.
5. Electrical Infrastructure and Backup Generators
The equipment list alone cannot confirm available IT power. Utility feeds, transformers, medium- and high-voltage switchgear, transfer equipment, busways, and generators determine whether electricity can reach the data hall safely and continuously. Fuel storage, maintenance access, emissions rules, and grid-interconnection limits then constrain how that system operates and expands.
The key distinction is between installed capacity, available capacity, and planned capacity. Installed transformers or generator compounds may support a future phase while halls remain unoccupied. A large advertised IT figure may instead reflect a campus allocation, an AI-estimated capacity, or a later build stage rather than commissioned load.
Trace the electrical route from the rack to the grid, recording what is physically present at each point:
- Rack distribution: Map PDUs and busways to the halls and rack rows they serve.
- UPS integration: Confirm which protected loads are covered and how maintenance affects continuity.
- Switchgear and transformers: Compare ratings and configuration with the stated IT allocation.
- Generators and fuel systems: Check backup coverage, fuel autonomy, testing requirements, and emissions constraints.
- Utility interconnection: Treat grid service as a possible project limit, particularly where connection capacity is constrained.
Generator type does not establish resilience by itself. Diesel, gas, and emerging alternatives can support different operating and permitting requirements. Transfer design, redundancy, fuel arrangements, and operating procedures determine which loads remain supported during an outage.
The Blyth Power Station data centre campus profile shows why facility identity and campus context matter. Multiple buildings or phases can have different commissioning statuses, so one MW label may combine operational, planned, and estimated capacity. Data Centers List provides a practical comparison layer for sorting sites by status, location, operator, and capacity, but disclosed figures should remain separate from AI-estimated values.
Procurement can limit delivery before the IT equipment arrives. Large transformers and switchgear affect construction sequencing, while generator emissions rules influence permitting and operating costs. Record those constraints alongside the equipment, rather than treating a headline capacity figure as proof of usable power.
6. Network Infrastructure and Interconnection Equipment
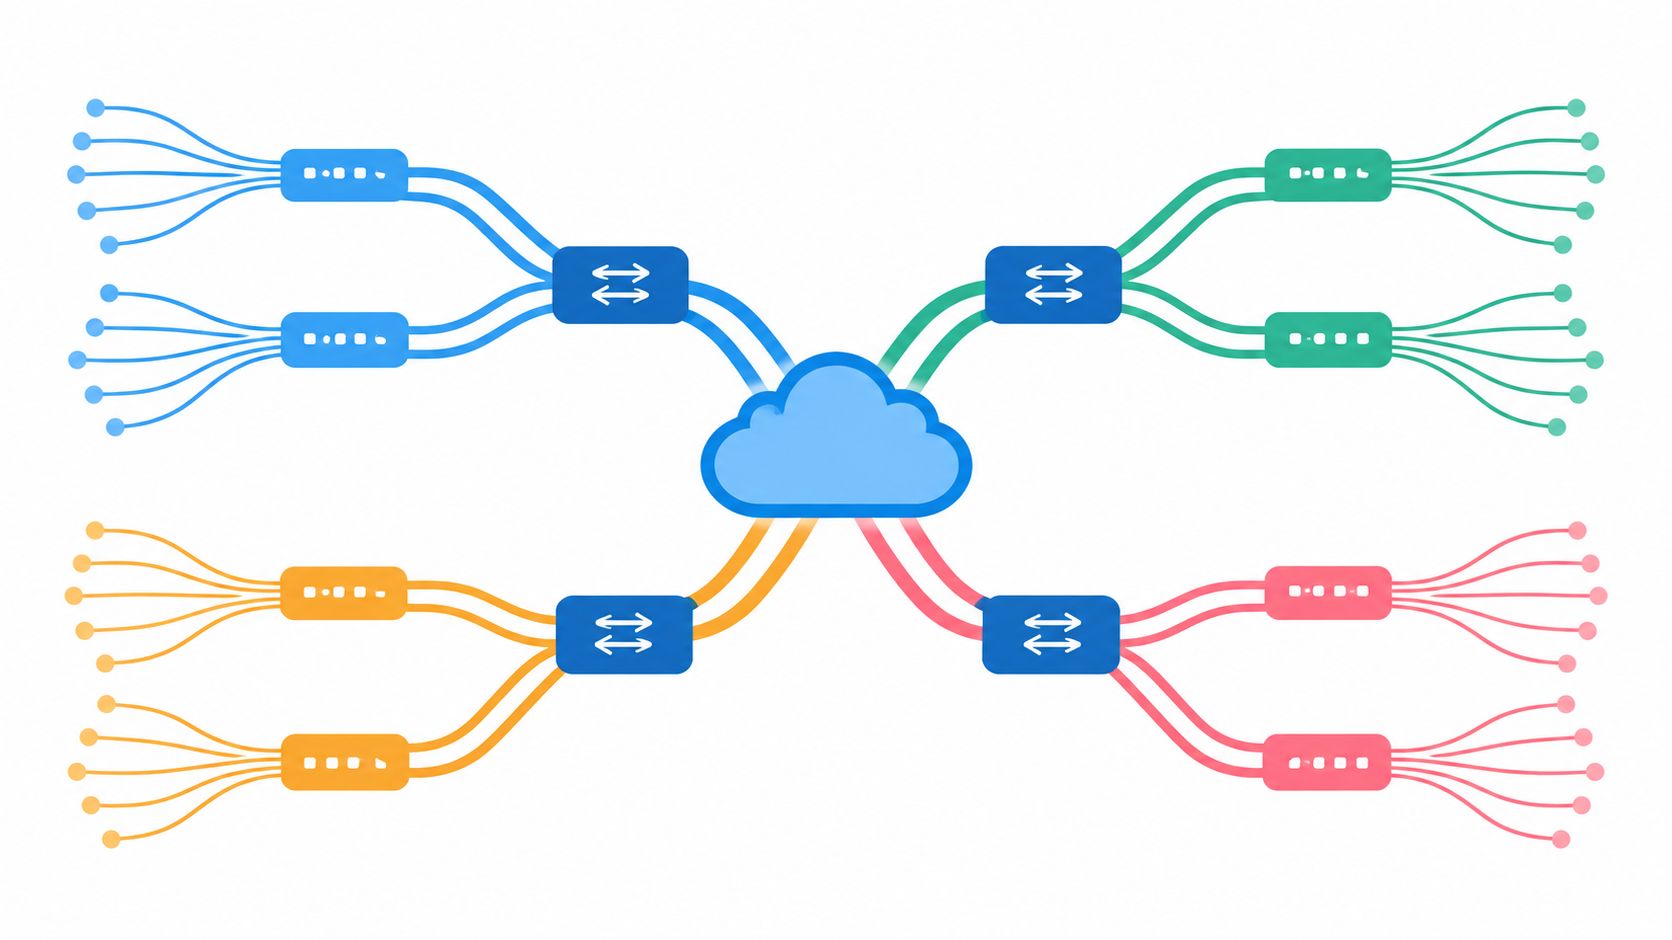
Network equipment is not merely a path between servers. Its design determines how quickly workloads exchange data, which external networks a facility can reach, and whether a colocation site can support carriers, cloud connections, internet exchanges, or private peers. Switches, routers, fiber, patch panels, optical transceivers, active copper cables, and cross-connects each serve different parts of that chain.
Capacity analysis should separate the physical network from the interconnection ecosystem. A site may have modern switching hardware but few carriers or diverse routes. Another may sit near a major fiber corridor or exchange yet offer limited connectivity inside the building. Those distinctions affect operational use, especially for latency-sensitive applications and distributed computing.
Traffic patterns provide a practical test. Enterprise applications, cloud access, content delivery, financial transactions, and AI clusters place different demands on network design. In accelerator-heavy environments, links between compute nodes can restrict performance even when servers and power are available. High-speed optical modules, dense cabling, and low-latency switching may therefore signal a specialized workload, but they do not prove the facility's total IT power.
Review the network through four questions:
- Internal fabric: Does the architecture support routine east-west traffic, or tightly coupled accelerated workloads?
- External paths: Which carriers, diverse routes, meet-me rooms, and cross-connects are available at the site?
- Optical roadmap: Are emerging 1.6T transceivers, active copper, or open optical networking documented, or merely assumed?
- Exchange proximity: Do public peering records confirm the stated connectivity rather than relying on the facility's city?
The Bulk Oslo Internet Exchange profile illustrates how a facility record can be compared with wider connectivity context. Data Centers List supports sorting sites by status, location, operator, and capacity. That comparison layer helps distinguish a named exchange or regional reputation from interconnection options documented at the specific facility.
Network evidence also affects confidence in capacity estimates. A large AI-oriented IT load requires a design capable of moving data within and beyond the cluster. If disclosures identify servers but omit network architecture, AI-estimated capacity may remain possible, yet the estimate warrants lower confidence than a disclosed figure supported by equipment and connectivity evidence.
7. Storage Systems and Data Protection
Storage equipment shows how a facility retains, serves, replicates, and restores data. Direct-attached storage may remain inside individual servers, while SANs, NVMe arrays, HDD systems, backup appliances, and object storage platforms can span multiple racks or halls. Replication, snapshots, backup, archival, and recovery controls add protection around those systems.
The storage design can reveal workload requirements that a server inventory leaves unclear. Transactional workloads generally require low-latency access, redundancy, and consistent availability. Archive-heavy environments may prioritize capacity and retention. A site running distributed object storage across many nodes needs different rack, network, and cooling arrangements from one relying on a monolithic array.
Storage therefore acts as a workload signal, not a direct measure of facility scale.
Reviewers should examine four questions:
- Media mix: Is the environment based mainly on NVMe, SSD, HDD, or mixed tiers?
- Protection model: Does it use local backup, cross-site replication, or distributed object storage?
- Power behavior: Are storage systems continuously active, or can archival tiers reduce operating intensity?
- Geographic role: Is the facility a primary production site, a recovery location, or part of a wider cloud region?
Storage capacity should not be converted directly into an MW estimate. A large data footprint can use relatively efficient media, while a smaller transactional workload may require intensive performance and redundancy. Storage evidence becomes more useful when matched with server type, network design, and disclosed operating status.
The distinction also matters when comparing facilities in Data Center List. Sorting sites by status, location, operator, and capacity helps analysts test whether a storage-heavy record represents active production, planned expansion, or a recovery function. Disclosed IT power remains stronger evidence than AI-estimated capacity, but storage architecture can support or weaken the estimate. Missing information about media, redundancy, or operating status should lower confidence rather than imply unused capacity.
For investment and site-selection analysis, storage can separate a compute expansion from a resilience expansion. Adding backup and replication may improve service continuity without creating equivalent customer-facing compute capacity. An equipment announcement should therefore be read as evidence of a particular operating role, not automatically as proof of increased usable IT power.
8. Environmental Monitoring and Building Management Systems
Environmental monitoring and building management systems translate building conditions into operating decisions. Sensors can measure temperature, humidity, air quality, water use, electrical consumption, leaks, and equipment alarms. Building management software can then coordinate cooling, lighting, alerts, and maintenance workflows across the facility.
The equipment itself is only part of the evidence. A site may disclose PUE, WUE, sustainability performance, or operating conditions, but those indicators depend on measurement boundaries, sensor coverage, reporting methods, and the period observed. Operator-published sustainability reporting can provide context, while facility-level metered data is preferable when available.
Facility monitoring platforms can collect information from power, cooling, and environmental devices across a single operational view. That integration helps analysts connect an alarm or consumption pattern to the equipment responsible, while also exposing gaps between a headline metric and the specific area it covers.
Separate measurements from estimates
A useful review classifies environmental evidence by reliability:
- Direct measurements: Meter and sensor readings tied to a defined facility boundary.
- Reported indicators: Operator-published PUE, WUE, power, or water figures.
- Inferred values: Estimates based on equipment type, site location, or comparable facilities.
This classification affects how AI-estimated IT capacity should be assessed. Monitoring evidence can support an estimate when observed power and cooling behavior are consistent with the modeled figure. Confidence should fall when reported indicators cover only part of the site, reflect an earlier operating state, or imply a smaller active footprint than the estimate.
These systems also matter in community and policy analysis. Water use, energy demand, noise-related operating conditions, and construction status can affect how a facility is assessed beyond its customer-facing role. Data Centers List's research views organize available context, including water usage, power consumption, noise levels, and jobs. An absent field signals missing evidence, not zero impact.
A reliable profile records what the facility discloses, what available sources verify, and what remains inferred. Monitoring systems make that separation possible by clarifying the operational boundary behind each headline figure.
9. Security Systems and Physical Access Control
Security controls do not add megawatts, but they can determine whether available capacity is usable for a customer's workload. Perimeter barriers, cameras, badge readers, biometric checks, mantraps, visitor systems, security operations centers, and cabinet or cage controls protect different points between public access and critical equipment.
The operational question is how these controls are implemented. A facility serving regulated financial, government, healthcare, or enterprise workloads may document access procedures, audit records, and custody controls in detail. A smaller edge site may use fewer layers because it has a smaller footprint and different staffing model. Limited public disclosure does not prove weak protection, since operators may withhold details for security reasons.
Assess the evidence by matching each control to its use case:
- Entry control: Determine whether visitor, employee, contractor, and customer routes are separated, and whether access is approved and logged.
- Asset protection: Check whether controls extend beyond the building perimeter to cages, cabinets, removable media, and loading areas.
- Monitoring response: Establish whether alarms reach an on-site or managed security operation with defined response procedures.
- Audit scope: Confirm that any certification covers the named facility, service, control set, and current assessment period.
Camera coverage or AI-assisted video analytics can support anomaly detection, but neither proves a particular security standard nor confirms continuous human response. The Overton Security physical security guide outlines layered physical protection and should be read alongside facility-specific evidence.
For comparisons in Data Center List, classify security information separately from capacity. Record the operator's disclosed controls, the facility status and location, and whether figures are disclosed or AI-estimated. A disclosed MW figure indicates stated power capacity, not suitability for sensitive workloads. Access-control evidence determines whether that capacity can meet custody, audit, and operational requirements. A missing security field means the evidence is incomplete, not that protection is absent.
10. Modular and Prefabricated Data Center Solutions
Modular data centers package some or all compute, power, cooling, networking, and security equipment into transportable or prefabricated units. They suit edge computing, disaster recovery, remote operations, temporary capacity, and phased expansion when a conventional building would slow deployment.
Examples include packaged edge compute appliances, containerized cloud infrastructure modules, telco-integrated edge racks, and AI-focused prefabricated systems. A supplier may provide a complete enclosure, a power-and-cooling module, or a pre-integrated rack. Each format can remain dependent on local utility service, carrier interconnection, backhaul, and site security before it delivers useful capacity.
Keep modular capacity separate
A module may be operational while the surrounding campus remains under construction. It may also be announced as a future deployment without a confirmed commissioning date. Data Center List should therefore record it as a distinct facility or phase, with status, location, operator, and capacity evidence kept separate from the wider campus.
Analysts should record:
- Integration boundary: Identify which systems arrive inside the module and which remain site-provided.
- Deployment purpose: Separate inference, backup, disaster recovery, and production workloads.
- Power source: Verify whether the module uses dedicated generation, shared utility service, or temporary supply.
- Cooling method: Check whether air, liquid, or hybrid cooling is included.
- Network dependency: Confirm the external connectivity required for operation.
A packaged unit can improve deployment flexibility without removing site constraints. Fuel, water, permitting, maintenance access, and backhaul affect operating capability. Record disclosed IT power separately from AI-estimated capacity, since an announced module, installed equipment, or connected utility service does not by itself prove usable load. Availability should be tied to commissioning evidence, not equipment presence alone.
Top 10 Data Center Equipment Comparison
| Component | Core features | Quality metrics & impact | Value proposition / USP | Target audience | Typical cost & deployment speed |
|---|---|---|---|---|---|
| Servers and Computing Hardware | Rack/blade servers, multi-socket CPUs, DDR5, remote mgmt, high density | Performance‑per‑watt, kW/rack, refresh cycle; drives MW estimates | Primary source of compute capacity; standardized specs aid benchmarking | Hyperscalers, cloud, colocation, enterprises | High CAPEX; procurement lead times; refresh every 3–5 yrs |
| Power Distribution Units (PDUs) | Intelligent monitored PDUs, outlet metering, switched outlets, APIs | Outlet‑level power accuracy, real‑time telemetry; improves capacity validation | Precise power allocation, chargeback, overload prevention | Colocation operators, facility ops, metering teams | Moderate cost; retrofits possible; deployment weeks |
| Uninterruptible Power Supplies (UPS) | Online/line‑interactive/offline topologies, modular scaling, battery chemistries | Runtime minutes, redundancy (N/N+1/2N), influences availability and PUE | Instant backup power; supports high‑availability tiers and graceful failover | Mission‑critical workloads, finance, gov, hyperscale | High CAPEX + OPEX; long install times (months) |
| Cooling & Climate Control Systems | Air/liquid cooling, free‑cooling, containment, VFDs, humidity control | PUE reduction, WUE (water use), temperature stability, enables density | Lowers energy/water use; enables higher rack density and efficiency | Sustainability‑focused operators, high‑density sites, regulators | Very high capital; retrofits expensive; months→years to deploy |
| Electrical Infrastructure & Generators | MV distribution, transformers, switchgear, ATS, redundant gensets, fuel storage | Generator MW, failover time, interconnection limits; critical for resilience | Independent power resilience; enables facility expansion where feasible | Large campuses, hyperscalers, regions with grid risk, finance | Very high cost; long lead times & permitting; months→years |
| Network Infrastructure & Interconnection | 400/800G switching, spine‑leaf, fiber diversity, IX peering | Latency, bandwidth, peering count, redundancy; impacts UX | Low‑latency connectivity, access to IX ecosystems, carrier diversity | CDNs, ISPs, cloud, enterprise colocation customers | Variable (moderate→high); upgrades frequent; weeks→months |
| Storage Systems & Data Protection | NVMe/SSD, hybrid tiers, RAID/erasure coding, replication, dedupe | IOPS, capacity (TB/PB), power per TB, replication overhead | Data durability, performance tiers, efficient capacity use | Enterprises, hyperscalers, backup/archival providers | Moderate→high CAPEX; deployment weeks; long refresh cycles |
| Environmental Monitoring & BMS | IoT sensors, power/water metering, HVAC controls, dashboards | PUE/WUE accuracy, alarm latency, sensor data quality; drives transparency | Enables optimization, compliance reporting, incident prevention | Operators, sustainability teams, regulators, investors | Low→moderate cost; phased rollout; weeks→months |
| Security Systems & Physical Access Control | Badges, biometrics, CCTV, SOC, perimeter barriers, access logs | Access auditability, incident detection/response time, compliance | Reduces physical risk, supports certifications (ISO, SOC, Uptime) | Regulated industries, gov, hyperscalers, customers needing high assurance | Moderate→high OPEX; continuous operations; deployment weeks→months |
| Modular & Prefabricated Data Centers | Container/modular units with integrated power, cooling, security | Fast time‑to‑deploy, higher cost/MW, limited per‑unit density | Rapid deployment, edge enablement, lower upfront capex, portable | Edge providers, telcos, emerging markets, DR use cases | Higher $/MW but quick deploy (days→weeks); scalable by modules |
Turn the Equipment List Into a Capacity Check
A strong capacity review begins by grouping equipment according to the job it performs. Compute includes servers, accelerators, memory, and local storage. Power includes utility connections, transformers, switchgear, UPS systems, generators, PDUs, and busways. Cooling includes air handlers, chillers, containment, pumps, heat exchangers, and liquid loops. Network covers switches, routers, optics, fiber, cross-connects, and external interconnection. Protection includes physical security, backup, replication, and operational safeguards. Monitoring includes meters, sensors, BMS platforms, alarms, and reporting systems.
The next step is to create two separate evidence columns. One should contain disclosed values, such as an operator-published IT power figure, named UPS output, documented generator configuration, or measured environmental indicator. The other should contain AI-estimated values, clearly labeled as estimates derived from facility attributes, public records, equipment patterns, or comparable sites. Those categories should never be blended into a single unlabeled capacity number.
A useful review then tests relationships rather than isolated facts:
- Compute against power: Do server types and rack assumptions fit the stated IT allocation?
- Power against cooling: Can the thermal architecture remove the heat implied by the load?
- Power against redundancy: Do UPS, generator, and switchgear arrangements support the claimed resilience?
- Network against workload: Does the interconnection design match the apparent role of the facility?
- Monitoring against disclosure: Are PUE, WUE, consumption, and capacity claims tied to a clear measurement boundary?
- Status against readiness: Is the equipment active, planned, or under construction?
The broader market context reinforces why this triangulation matters. The Straits Research data center hardware market overview describes a stack that extends from servers, storage, and networking into PDUs, UPS systems, cooling, and racks. Its estimates place the global data center equipment market at about USD 53.85 billion in 2022, with another forecast reaching USD 78.11 billion in 2025 and USD 238.41 billion by 2034. These figures describe market scale, not the capacity of any individual facility, so they shouldn't be used as a shortcut for site-level validation.
Off-premises demand adds another reason to track facility systems, not just IT hardware. Uptime Institute's annual survey reports that 55% of IT workloads were hosted in remote data centers in 2024 to 2025, compared with 42% in 2020, and respondents expected the share to reach 58% by 2026 to 2027. The figures are survey findings and expectations, not a forecast of every facility, but they help explain why power, cooling, monitoring, and resilience evidence matter in market comparisons.
Data Centers List supports this workflow through facility profiles, status labels, operator views, capacity rankings, map overlays, and a crawlable table sortable by location and capacity. Its directory covers 6,052 sites across 175 countries, according to the publisher's platform data, and includes operational, planned, and under-construction facilities. That breadth is useful only when readers preserve the distinction between a disclosed figure and an estimate.
No single equipment disclosure proves total capacity. A server announcement may omit electrical headroom. A generator compound may support a future phase. A cooling system may be sized for a different rack density than the current deployment. Before making a site-selection, investment, infrastructure, or community-impact judgment, analysts should triangulate the MW figure with power delivery, thermal systems, network design, operating status, and monitoring evidence.
Data Centers List offers searchable facility profiles, status and operator filters, capacity labels, map overlays, rankings, and a sortable comparison table for disclosed and AI-estimated IT power. Visit Data Centers List to compare the equipment and capacity signals behind data center sites more systematically.