Data Center Capacity MW: A Practical Guide to IT Power
Understand data center capacity MW with a clear guide to disclosed vs estimated figures, benchmarking methods, and how to compare facilities across markets.
15 min read
Global live IT capacity was 45,676 MW in 2024, rising to a forecast 55,646 MW in 2025 and 66,504 MW in 2026. Yet the amount a tenant can obtain within a 12 to 36 month window is far smaller than headline capacity once grid access, permitting, construction status, and energisation are tested.
That distinction defines how data center capacity MW should be read. A market can show a large pipeline while offering little near-term power, because announced capacity may include land options, planned buildings, and future utility upgrades. For operators, investors, and site selectors, the useful question isn't merely how many megawatts exist. It's how many bankable megawatts can flow to the right site, in the right market, on the required schedule.
Table of Contents
- Why Data Center Capacity in MW Matters Now
- What MW Really Means in a Data Center
- How Capacity Is Measured and Reported
- Conventional Sites vs AI Hyperscale Campuses
- The Gap Between Announced MW and Deliverable MW
- Comparing Capacity Across Facilities and Operators
- Stress Testing Capacity Claims for Site Selection
Why Data Center Capacity in MW Matters Now
The global scale is already measured in tens of gigawatts, not isolated single-building projects. Knight Frank's 2025 forecast placed live global IT capacity at 45,676 MW in 2024, with projected capacity of 55,646 MW in 2025 and 66,504 MW in 2026 in its global data center report. That implies roughly 10,000 MW of additional live IT capacity between 2024 and 2025, followed by another 10,858 MW between 2025 and 2026.
The regional distribution matters. The Americas accounted for 22,464 MW in 2024, forecast to reach 28,341 MW in 2025 and 34,589 MW in 2026, making North America the largest regional demand center for MW-scale capacity according to the same report. A separate market estimate placed current global capacity at about 59 GW in early 2025, broadly consistent with the scale of the Knight Frank forecast, rather than suggesting a market confined to a few gigawatts.
Why square footage is a weak proxy
Operators, brokers, real estate investors, and hyperscalers use MW because power determines how much computing infrastructure a facility can support. Square footage can describe a building, but it doesn't reveal whether the electrical plant, cooling system, switchgear, and utility connection can support a dense AI deployment.
Rack counts have the same limitation. Two halls with similar floor areas may support radically different loads if one contains conventional enterprise equipment and the other contains high-density accelerated computing. MW is the common denominator, but only when the reported figure identifies what kind of MW it represents.
| Metric | Value (MW) | Source / Note |
|---|---|---|
| Global live IT capacity, 2024 | 45,676 | Knight Frank 2025 forecast |
| Global live IT capacity, 2025 forecast | 55,646 | Knight Frank 2025 forecast |
| Global live IT capacity, 2026 forecast | 66,504 | Knight Frank 2025 forecast |
| Americas capacity, 2024 | 22,464 | Knight Frank 2025 forecast |
| Americas capacity, 2025 forecast | 28,341 | Knight Frank 2025 forecast |
| Americas capacity, 2026 forecast | 34,589 | Knight Frank 2025 forecast |
The practical reading rule
A disclosed live IT load deserves more weight than a site announcement. Capacity under construction deserves a separate label, while planned or speculative capacity should remain in the pipeline rather than being treated as inventory.
Practical rule: A capacity total is useful only when its status, power definition, delivery date, and grid position are visible.
That rule changes investment diligence. Instead of asking whether a market has enough announced MW, a decision-maker should ask whether enough power is energised, contracted, permitted, and deliverable for the intended workload.
What MW Really Means in a Data Center
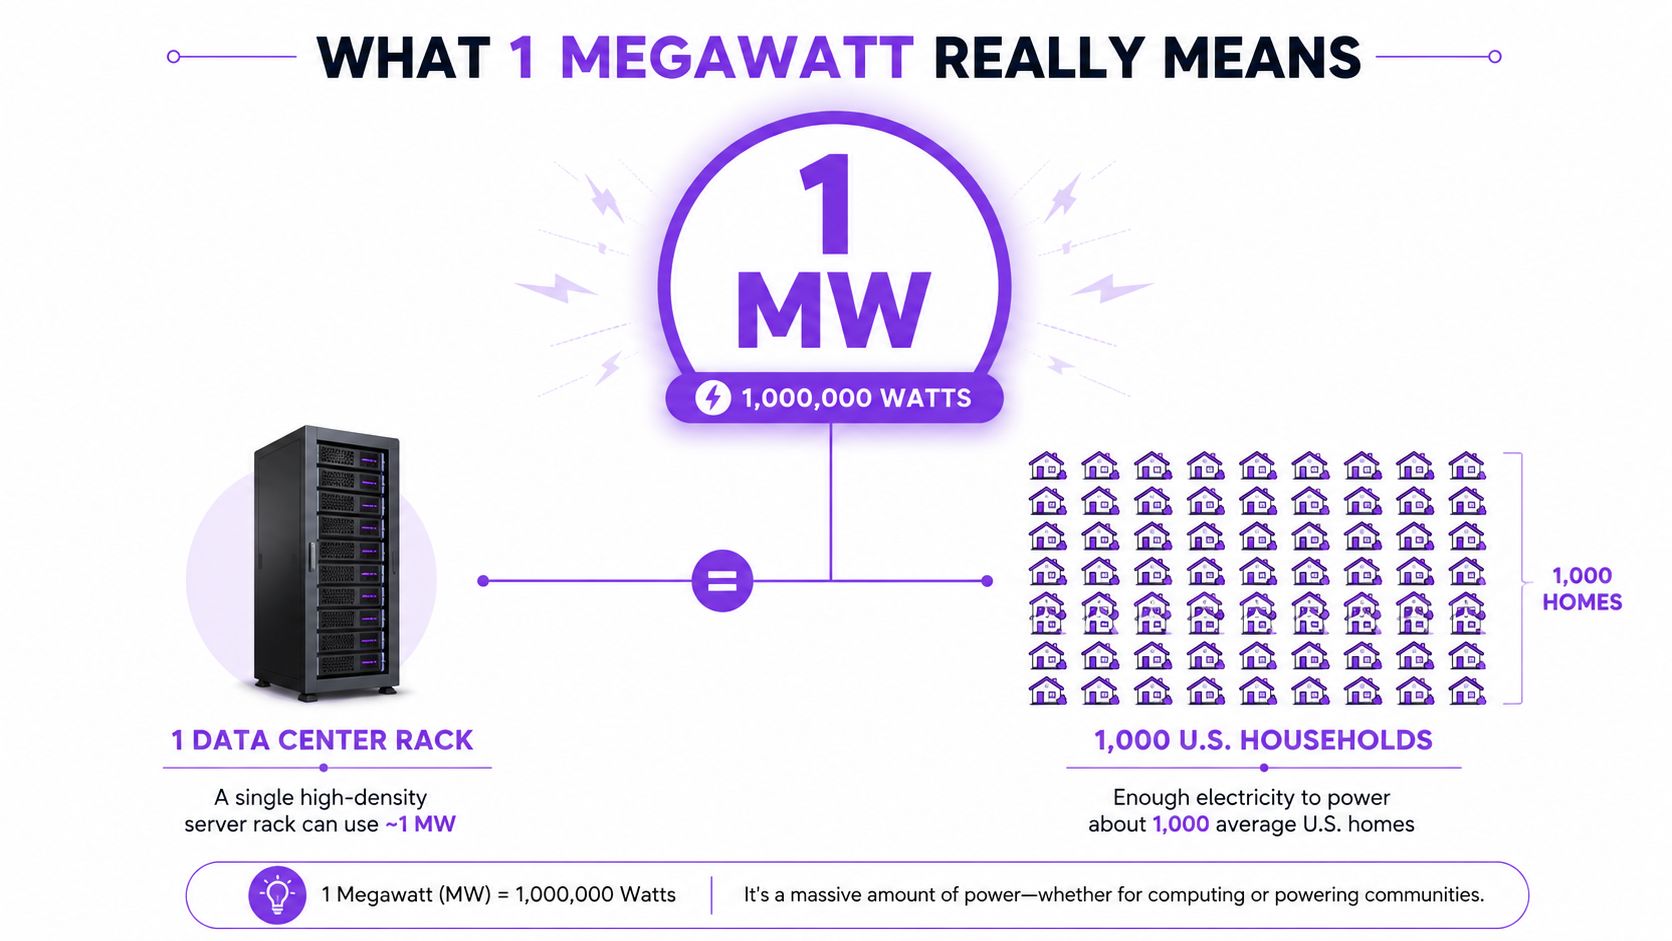
A megawatt measures instantaneous power demand. In a data center, that demand supports IT equipment along with cooling, power conversion, distribution, backup systems, and other critical infrastructure. The number becomes meaningful only after the reporting party explains whether it refers to total facility power, critical load, or tenant-available IT power.
The distinction is easy to miss. Nameplate MW describes a rated design or equipment capacity. Critical MW generally refers to the load the electrical system is engineered to support for critical operations. Usable MW is the portion a tenant can draw after cooling overhead, electrical losses, redundancy, operating headroom, and the provider's allocation policy are considered.
The denominator changes the answer
A facility can advertise a large campus figure while offering a smaller contracted load on day one. For example, a reported campus total may include future phases, reserved utility capacity, or electrical infrastructure that hasn't yet been commissioned. That figure shouldn't be compared directly with a live IT-load disclosure from another operator.
The cleanest analysis separates four questions:
- What is live? Capacity already operating and receiving power.
- What is critical? The engineered load supported by the facility's electrical design.
- What is tenant-available? The amount a customer can contract and draw.
- What is future? Capacity dependent on construction, permits, utility work, or later phases.
This distinction is especially important for AI deployments. A tenant may need a stable high-density load rather than access to a large theoretical campus total. The relevant figure is the deliverable IT block, not the maximum eventual site rating.
Why site selection depends on precision
A site selector comparing facilities should record the MW definition beside every number. A disclosed IT load, an estimated facility rating, and a utility reservation are different data points, even when each is expressed in megawatts.
That discipline prevents false equivalence. It also makes capacity comparisons more useful for financial models, procurement schedules, and technical due diligence, because the analysis reflects power that a customer can use rather than capacity that exists only in a planning document.
How Capacity Is Measured and Reported
Capacity reporting starts at the utility connection and moves inward through substations, medium-voltage distribution, transformers, switchgear, and the IT hall. The voltage architecture helps explain why two facilities with similar MW labels may have very different delivery requirements.
A small site under 10 MW may connect at about 13.2 kV, while a hyperscale facility above 100 MW may require 115 kV to 230 kV transmission-level service in the United States, often with dedicated substations and extended lead times, as described in research on data center power infrastructure. Those figures aren't cosmetic engineering details. They signal the scale of utility coordination, protection systems, transmission work, and redundancy required before the reported load can reach the racks.
Rack density adds another layer. AI workloads can reach 30 to 100+ kW per rack, compared with 7 to 10 kW for traditional server racks, according to the same research. A facility's MW figure therefore depends not only on the number of racks, but also on the workload profile, cooling architecture, busway design, floor loading, and electrical distribution strategy.
Capacity drivers behind a reported MW number
| Infrastructure Layer | Typical Range | Impact on Reported MW |
|---|---|---|
| Small-site grid connection | Under 10 MW, about 13.2 kV | May fit within a distribution-level connection |
| Hyperscale grid connection | Over 100 MW, about 115 to 230 kV | Can require transmission-level service and a dedicated substation |
| Traditional server rack | 7 to 10 kW | Supports lower-density deployments |
| AI server rack | 30 to 100+ kW | Raises cooling, busway, and floor-loading requirements |
| Facility load | Site-specific | Depends on IT load, overhead, redundancy, and operating headroom |
How operators create inconsistent comparisons
One operator may disclose critical IT load. Another may report total utility service. A third may publish a future campus target that includes multiple phases. Without a consistent field definition, a ranking can place unlike assets on the same list.
A structured data center predictive modeling resource can help analysts identify where capacity is disclosed and where it must be estimated, but estimates should remain clearly separated from operator-reported figures. The right workflow preserves the distinction rather than blending both into a single headline.
The analyst should also record timing. A power block that exists electrically but lacks commissioning, tenant allocation, or operational readiness isn't equivalent to live capacity. MW is a physical measure, but capacity is also a status measure.
Conventional Sites vs AI Hyperscale Campuses
A conventional data center typically requires 10 to 25 MW per site, while an AI data center can consume 200 to 400 MW per site, according to Cushman & Wakefield's 2025 power challenge research. The difference changes how analysts should read capacity totals. A small number of AI projects can represent more planned load than many conventional facilities, while still depending on larger grid and construction programs.
At the upper end of the conventional range, a 200 MW AI facility equals roughly eight conventional 25 MW sites. A 400 MW AI facility equals roughly 40 sites at that same upper-end benchmark. The arithmetic explains why a single campus announcement can reshape a regional pipeline before any rack receives power.
| Attribute | Conventional Site, 10 to 25 MW | AI Hyperscale Campus, 200 to 400 MW |
|---|---|---|
| Development pattern | Incremental halls or fit-outs | Large phased campus |
| Utility requirement | Facility-scale interconnection | Transmission-scale planning may be required |
| Rack profile | Lower-density traditional racks | High-density AI racks |
| Cooling design | Conventional mechanical systems | More demanding high-density cooling |
| Capacity effect | Adds moderate blocks to supply | Can equal many conventional sites |
| Delivery risk | Often tied to local building and utility work | Also tied to substations, transmission, and major equipment |
Why the pipeline math diverges
Conventional capacity can be added through successive fit-outs within an existing shell. AI campuses require coordinated power, cooling, networking, and specialized halls. At that scale, the utility connection, substation work, or equipment schedule may control the delivery timeline.
The distinction changes regional comparisons. A market with many conventional facilities may provide smaller, distributed deployments. A market with one large AI campus may show a much higher MW total concentrated in one project. Those totals do not imply the same tenant flexibility, construction exposure, or dependence on a single grid connection.
A proposed large AI campus example shows why announced scale should remain separate from operating capacity. A directory record can help analysts identify the project, its reported status, and its planned size. It should not be counted as live IT load until power is commissioned and the applicable capacity definition is confirmed.
The practical benchmark is deliverable power, not the largest figure attached to a project. Compare operators using the same MW definition, then test whether each site has the grid connection, equipment, and commissioning status needed to support that figure.
A hyperscale headline can move a market ranking overnight, but it cannot energize a rack before the utility and construction sequence is complete.
The Gap Between Announced MW and Deliverable MW
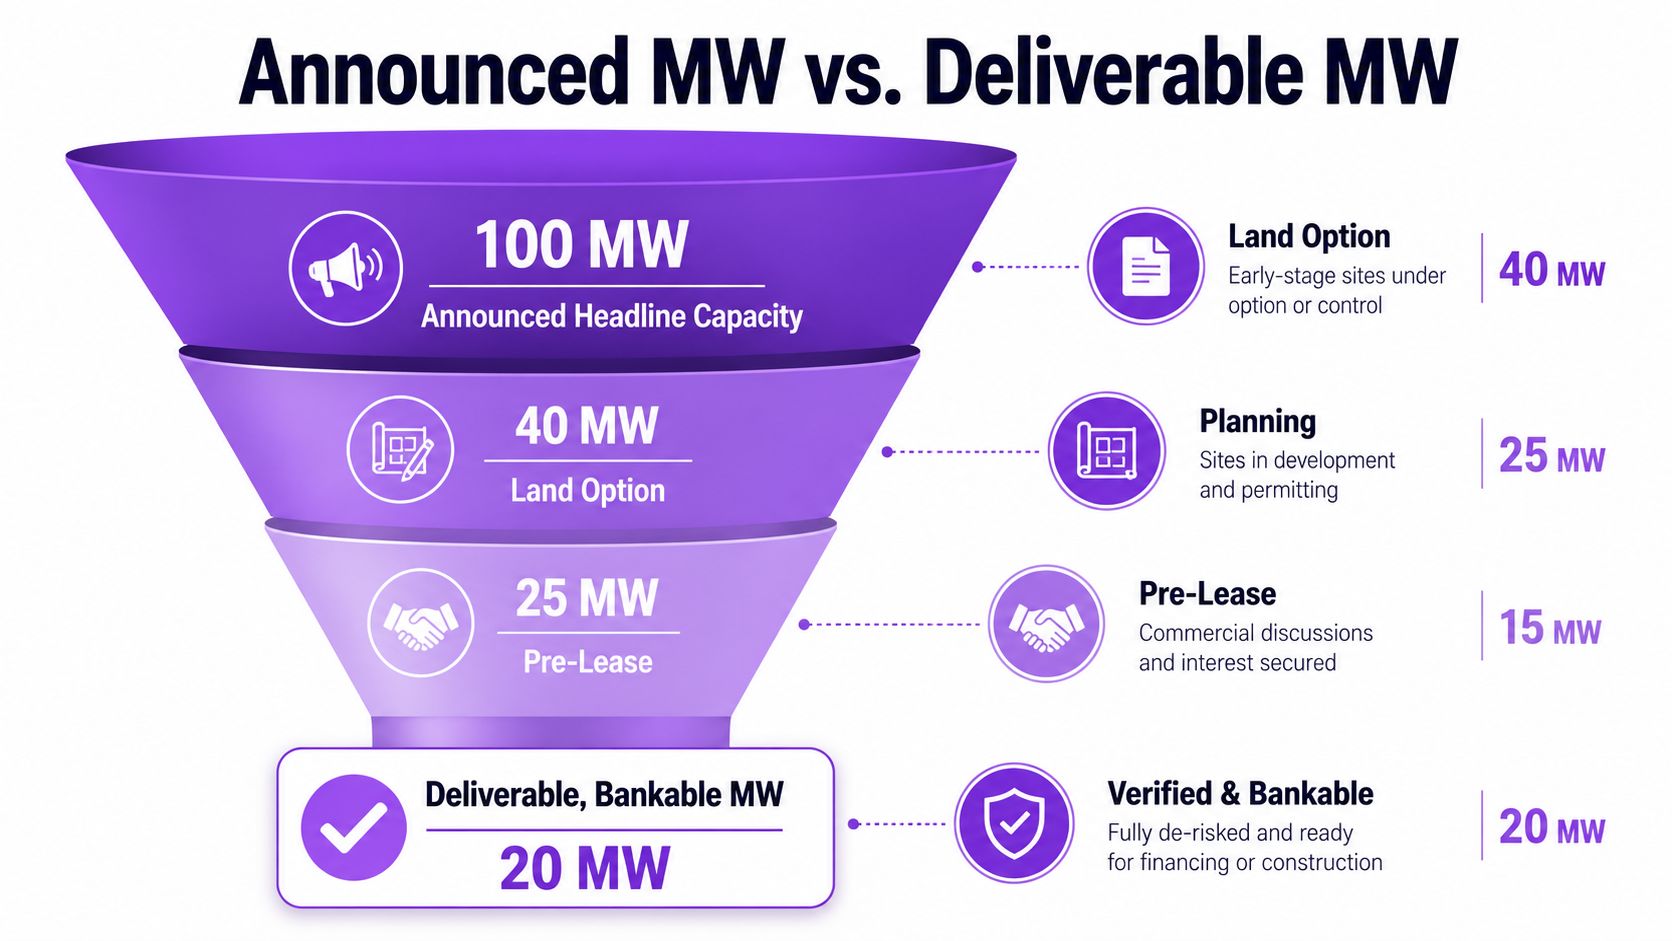
Announced capacity can exceed deliverable power by a wide margin. A project may sit in a market inventory while remaining at land-option, planning, pre-lease, construction, or utility-upgrade stage. Each stage has a different probability of completion. Adding them together creates a headline total that conceals delivery risk.
The market evidence shows why this distinction matters. In Q1 2026, supply across the 16 largest global markets reached 16 GW, up 25% year over year, while available space remained extremely scarce, according to CBRE's global data center supply and demand update. In North America, demand reached a record 25 GW of absorption in H1 2026, with vacancy near 1%. A projection placed U.S. capacity at 62,242 MW in March 2026 and 151,734 MW by 2030. Those figures describe different conditions, so they should not be read as equivalent measures of power available to a tenant.
Read the pipeline as a probability stack
The relevant question is which project stage has been verified and what remains before a customer can draw power.
- Land control: Does the developer own the site, control an option, or only identify a target location?
- Planning and permits: Has the relevant authority approved the development, or is the proposal still conceptual?
- Utility position: Is the interconnection study complete, with upgrades funded and scheduled?
- Construction: Is physical work underway, or does the project still await financing and final design?
- Energisation: Has the utility delivered power, and has the operator commissioned the IT load?
A planned MW figure should not receive the same weight as a live disclosure. For example, Amazon's Louisiana data center campuses can be tracked as an announced development, but its recorded capacity should remain separate from operating inventory until the power path and commissioning status are documented.
The same issue appears in EMEA. Only 850 MW of new capacity was added from January through 2025 year to date, 11% below the prior year, even as contracted capacity rose to 14,500 MW, as reported in the regional capacity coverage. Contracted demand can therefore coexist with constrained physical delivery.
Use a delivery window, not a headline total
For site selection, the most decision-useful measure is deliverable MW within 12 to 36 months. Capacity outside that window may support long-term planning, but it should not be credited against an immediate deployment requirement.
Discount each project according to status, substation readiness, utility queue position, construction progress, and pre-lease commitments. A pipeline becomes usable capacity only when its power path, schedule, and commissioning evidence support the stated MW.
Comparing Capacity Across Facilities and Operators
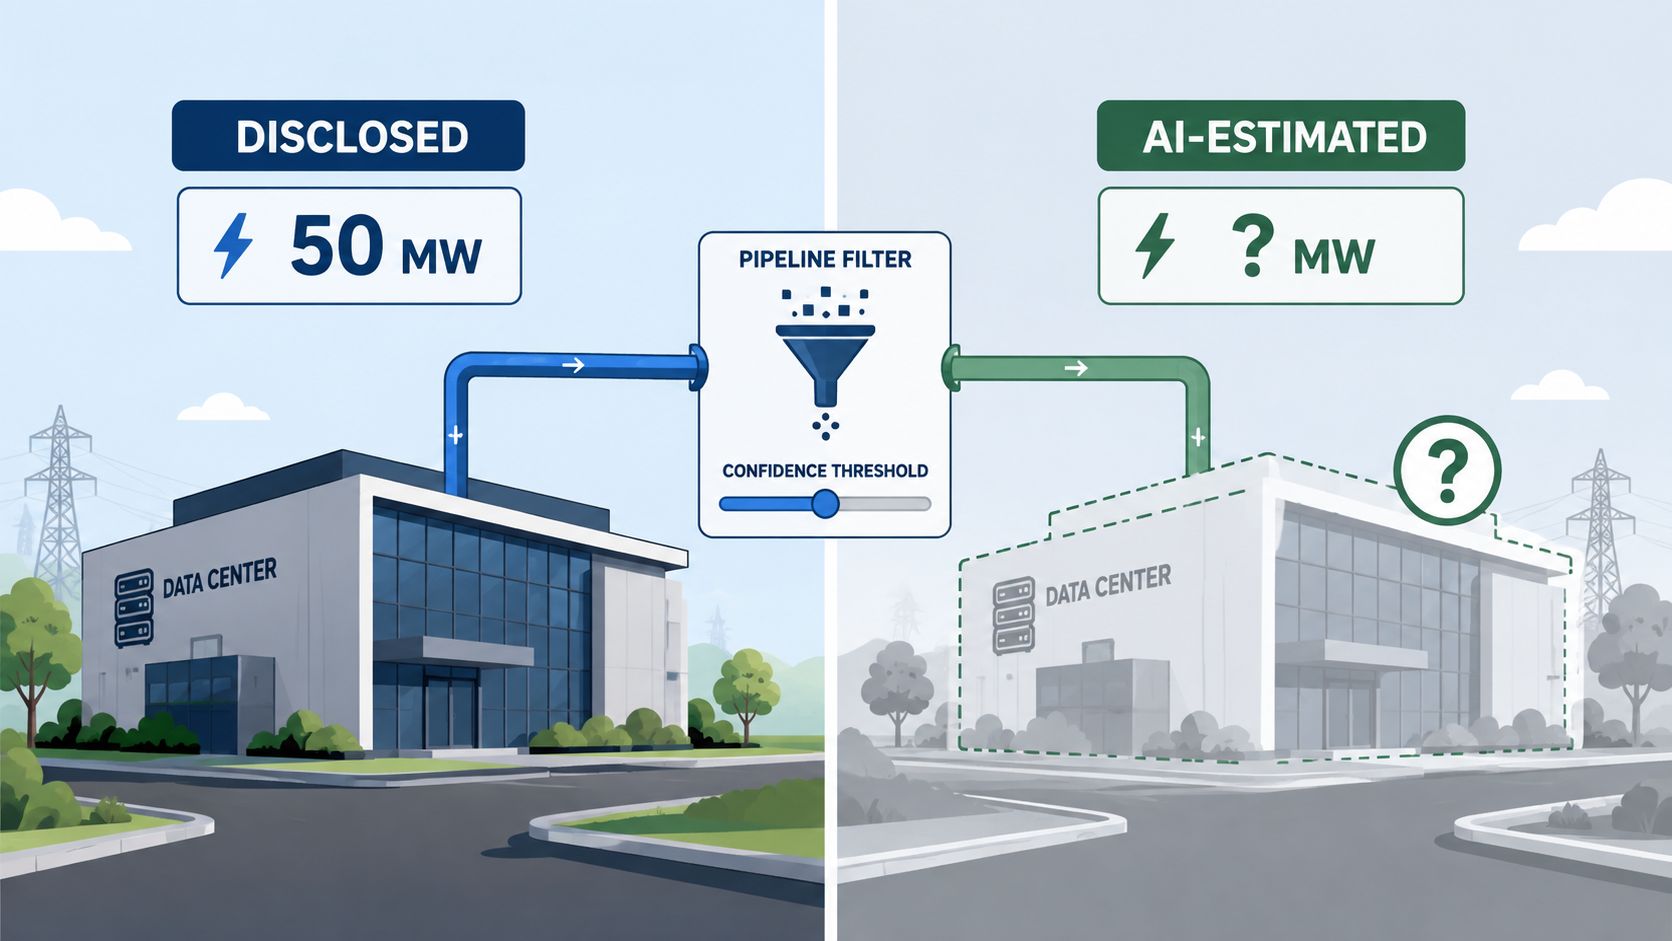
Comparison works only when the records use consistent definitions. A market table should preserve the difference between disclosed MW and AI-estimated MW, because an operator-reported figure and a modelled estimate don't carry the same evidentiary weight.
Data Centers List provides facility records with IT power in MW, status labels, and a disclosed or AI-estimated flag. Its pipeline view can separate active, planned, and under-construction sites, allowing an analyst to compare markets without treating future capacity as operational inventory.
A disciplined comparison workflow
Set the market boundary. Filter by country, region, metro area, or defined development cluster. A broad national total can conceal the local grid constraint that determines whether a site is usable.
Separate status first. Review active facilities independently from planned and under-construction projects. Status is the first filter because a future site shouldn't inflate the current operating base.
Split disclosed and estimated figures. Sort the disclosed rows by IT load, then review estimated rows separately. Estimated MW can identify likely scale, but it should remain directional until public documentation confirms the number.
Normalize the capacity definition. Check whether each record refers to IT power, critical load, utility service, or a planned campus total. If the definitions differ, the table should show that limitation rather than forcing a false ranking.
Cross-check the pipeline. Compare project status against operator announcements, planning records, and utility information. The purpose isn't to replace the directory record, but to test whether the stated delivery stage supports the claimed MW.
Benchmarking operators without overstating precision
An operator ranking can answer how much disclosed live IT capacity a brand controls in a market. It can't, by itself, establish how much spare capacity remains, whether the load is contracted, or how quickly a new tenant can receive power.
The most defensible output has separate columns for live disclosed MW, live estimated MW, under-construction MW, and planned MW. That format gives decision-makers a visible confidence hierarchy instead of a single total that blends operational assets with speculative pipeline.
Stress Testing Capacity Claims for Site Selection
Grid access decides whether a capacity claim becomes useful. A large-load facility may require dedicated interconnection studies, higher-voltage service, and a substation, while a 100 MW facility often needs redundant feeds for reliability, according to National Renewable Energy Laboratory analysis of large-load interconnection constraints.
The constraint is increasingly local. Transmission saturation, queue depth, and time-to-power can delay new capacity for years in stressed markets. That means a market with substantial announced MW may still fail a near-term site-selection test if the utility can't provide a documented energisation path.
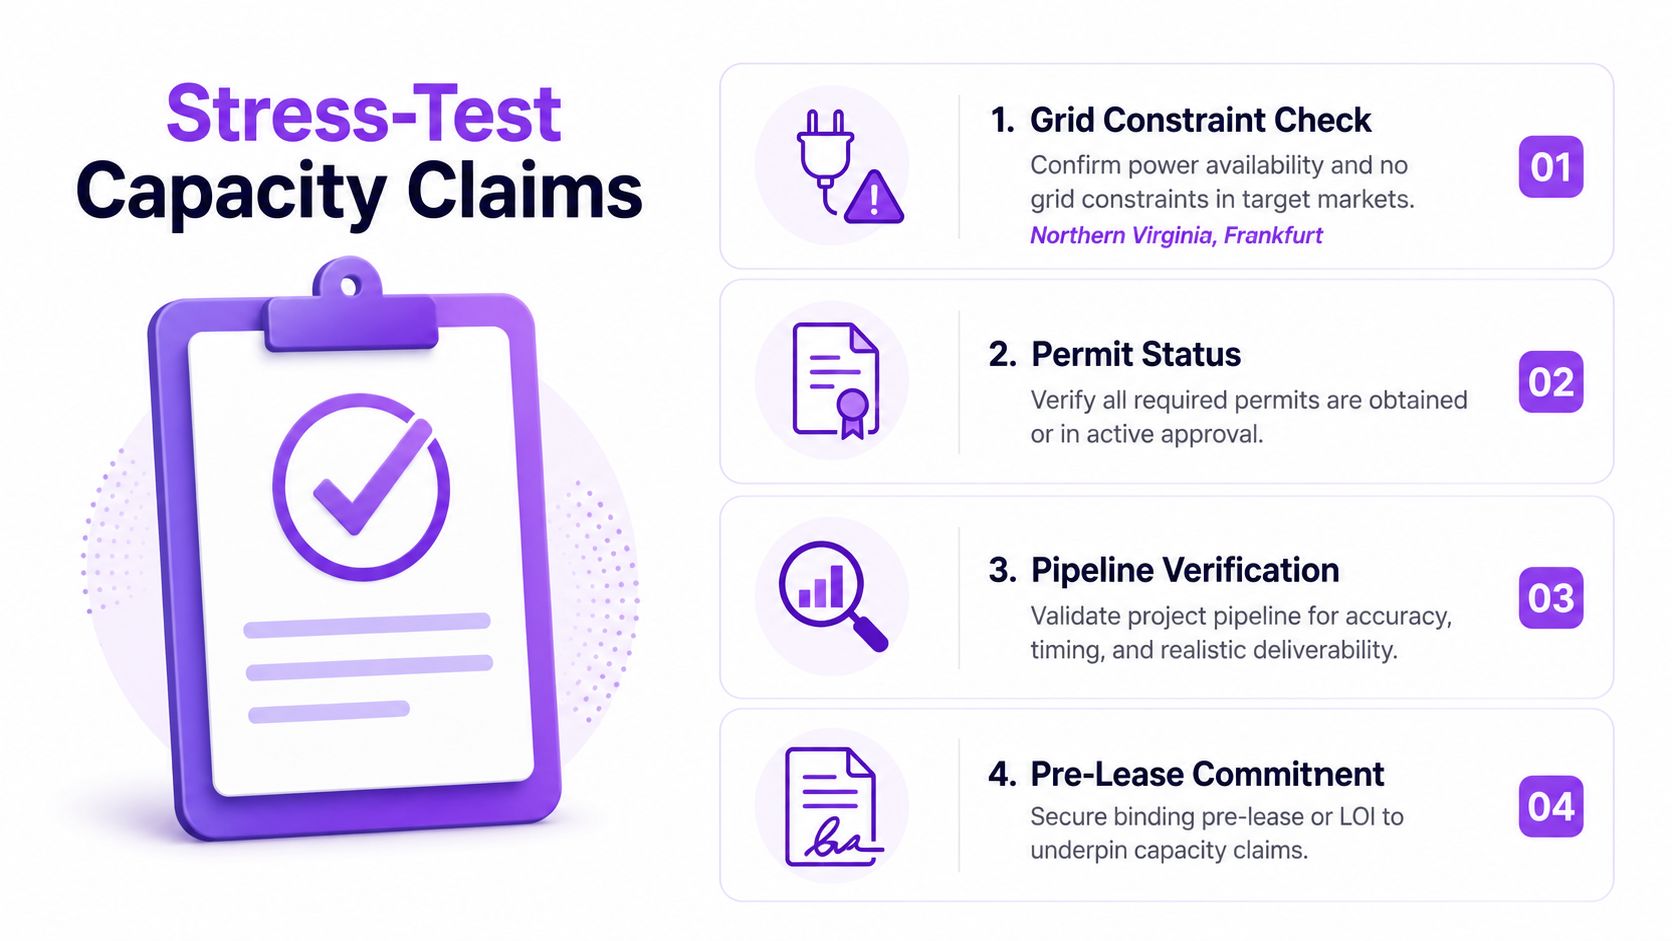
Six verification questions
- Define the number: Is the figure disclosed by the operator, estimated from public evidence, or inferred from a broader campus plan?
- Confirm the status: Is the facility active, under construction, permitted, planned, or still tied to a land option?
- Test the power path: Has the utility completed the interconnection study, and what upgrades remain?
- Check control: Does the developer control the land, substation, and transmission connection, or depend on future third-party actions?
- Measure tenant availability: How much IT MW can a customer contract, and when can that block be energized?
- Set the delivery window: Does the project satisfy the required 12 to 36 month schedule, or does it belong in a longer-term scenario?
Three market-specific tests
A constrained FLAP-D market should be tested first for queue position and substation availability. In a mature European cluster, a large pipeline number doesn't answer whether transmission headroom exists for a new load. The claim passes only when the utility timeline and energisation sequence are documented.
An emerging European market may offer more development flexibility, but the analyst shouldn't assume that available land equals available power. The review should focus on grid reinforcement, permitting progress, and whether the proposed capacity is live, contracted, or merely planned.
A Tier-2 U.S. market may present a smaller existing ecosystem and a clearer path to land control, yet the same questions apply. A site with a promising MW target still needs a verified interconnection route, construction schedule, and tenant-ready IT block.
The conclusion is straightforward. Power that flows matters; power that is announced does not. A capacity report becomes decision-grade only when it shows what is live, what is deliverable, and what remains dependent on grid and construction milestones.
Data Centers List gives operators, developers, site selectors, and analysts a searchable view of active, planned, and under-construction facilities, with IT power separated into disclosed and AI-estimated figures. Visit Data Centers List to compare markets, filter pipeline status, and stress-test data center capacity MW against the delivery realities behind each headline.