10 Top Data Center Markets to Watch in 2026
Compare the top data center markets worldwide by MW, pipeline, operators, risks, and selection insights for investment and site strategy.
21 min read

Northern Virginia closed 2025 with 4,039.6 MW of total data center inventory, after adding more than 1 GW of new capacity in a single year. CBRE also recorded 1,102 MW of net absorption, while available supply fell to 21.5 MW, an example of how quickly demand can outpace deliverable capacity in established hubs. CBRE's 2025 Northern Virginia market data makes the central point clear: the biggest market isn't automatically the best location for every workload.
Table of Contents
- How to Read the Global Data Center Map
- 1. Northern Virginia
- 2. Dublin
- 3. Frankfurt
- 4. London
- 5. Tokyo
- 6. Singapore
- 7. Amsterdam
- 8. Sydney
- 9. Paris
- 10. São Paulo
- Top 10 Global Data Center Markets Comparison
- Turn Market Rankings Into a Site Decision
How to Read the Global Data Center Map
Market leadership isn't defined by MW alone. Buyers and investors need to weigh operational capacity, planned and under-construction supply, network connectivity, operator depth, customer concentration, power access, water constraints, regulation, and expansion feasibility. A market with enormous installed capacity can still be a poor fit if the required utility connection is unavailable or the delivery timeline conflicts with a deployment schedule.
This ranking combines those factors with practical deployment fit. Established hubs appear first because they offer deeper ecosystems and proven interconnection value. Regional gateways follow where local demand, sovereignty requirements, or geographic reach can outweigh a smaller installed base. Figures supplied for individual markets should be checked against current operator disclosures, utility conditions, and planning approvals before a transaction or site decision.
Data Centers List adds a facility-level comparison layer, with operator, status, location, and IT-power fields across operational, planned, and under-construction sites. Its distinction between disclosed and AI-estimated IT power helps readers separate reported capacity from modeled information instead of treating every figure as equally certain. The ranking moves from the largest established hub to strategically important gateways, with each market translated into a specific site-selection or investment implication.
1. Northern Virginia
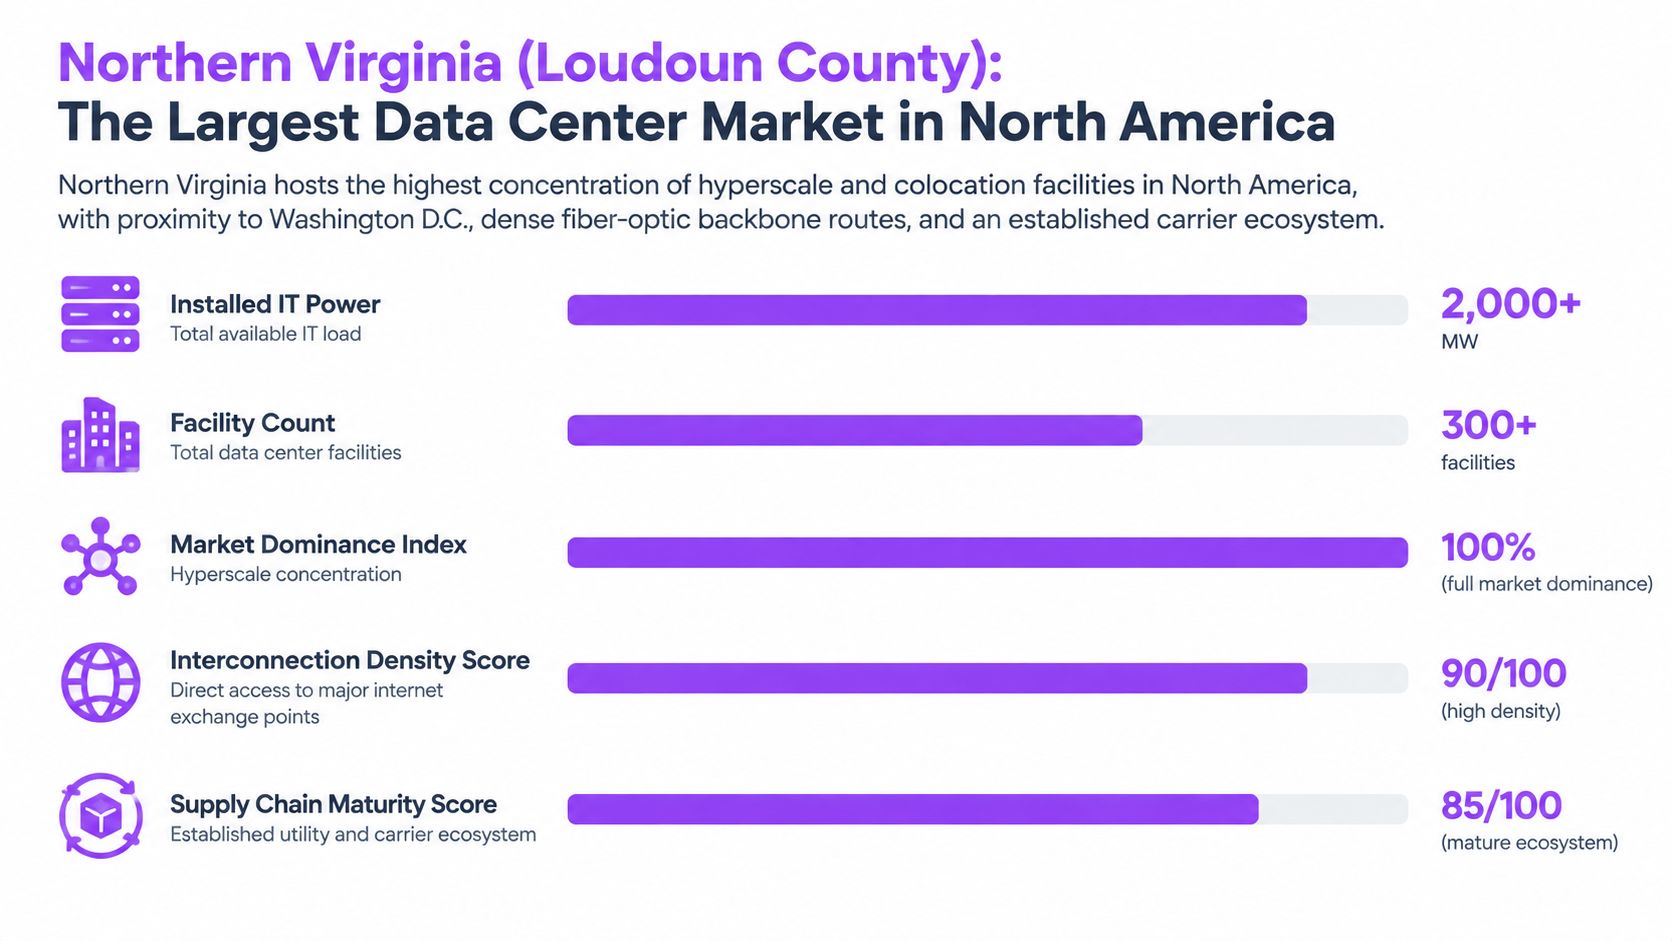
Northern Virginia remains the clearest benchmark among the top data center markets. CBRE reported 4,039.6 MW of total inventory at the end of 2025, a 37% year-over-year increase, after more than 1 GW of new capacity came online during that year. The market also recorded 1,102 MW of net absorption, up 144% from 2024, while available supply dropped to 21.5 MW, implying a 0.5% vacancy rate. CBRE's market release shows why scale alone understates the market's strategic importance. Northern Virginia combines scale with unusually intense demand.
Another industry assessment described the region as having more than 3.5 GW of commissioned IT capacity across more than 300 facilities, reinforcing its role as a foundational reference point for global analysis. Data Center List's Digital Realty Loudoun facility profile illustrates the value of comparing individual assets rather than relying only on metro-level rankings.
Where the market fits
Northern Virginia suits hyperscale deployments, dense interconnection requirements, government-related workloads, and enterprise platforms that benefit from a mature carrier ecosystem. Equinix, Digital Realty, CyrusOne, AWS, Google, and Microsoft all have a presence associated with the region, giving customers multiple operating and partnership models.
Practical rule: Treat Northern Virginia as a benchmark for network value and operator depth, but test power delivery, water exposure, community constraints, and expansion timing before assuming that available land equals available capacity.
Data Center List filters can help compare Loudoun County facilities, planned projects, and construction status. For investors, the scarcity profile supports strong demand analysis, while the same scarcity raises delivery-risk and acquisition-pricing questions. Northern Virginia data center e-waste compliance is also relevant to operators planning equipment refreshes and end-of-life processes.
2. Dublin
Dublin's strategic value comes from the combination of European regulatory access, transatlantic connectivity, and sustained technology-sector demand. Its role within the FLAP-D cluster gives the market regional significance, while grid access and permitting determine how much of that demand can become operational capacity.
Across the five-market cluster, live capacity reached about 3.8 GW in the first half of 2026, compared with 1.8 GW in 2019. The group also had 1.4 GW under construction and 2 GW planned, according to Brightlio's data center market statistics. These figures are not a Dublin inventory estimate. They indicate the scale of the European supply base competing for the same cloud, enterprise, and connectivity-led demand.
Why Dublin attracts regional deployments
Dublin suits cloud platforms, software companies, and enterprises that need European processing capacity with strong links across the Atlantic. Large-scale operators and colocation providers have established activity in the market, offering choices between campus-style deployments and connectivity-focused facilities. Digital Realty's Dublin facility profile illustrates how facility-level information can clarify operator presence, asset characteristics, and deployment fit.
Connectivity supports Dublin's demand case, but it does not remove delivery risk. Site-selection teams should verify utility capacity, planning conditions, cooling design, water-stress exposure, and expansion land before treating a proposed site as deployable capacity.
Deployment implication
Dublin fits strategies that prioritize European reach and transatlantic routes over geographic diversity within continental Europe. It is a weaker fit for plans built around unlimited local expansion or rapid replication across nearby sites.
Investors and buyers should compare Dublin with Frankfurt, London, Amsterdam, and Paris across interconnection, regulatory fit, power feasibility, and pipeline timing. Installed capacity indicates market depth, while disclosed project status and facility-level evidence provide a better test of what can be delivered.
3. Frankfurt
Frankfurt earns its place through interconnection value, financial-services demand, and access to Europe's largest network ecosystems. The broader FLAP-D cluster recorded about 3.8 GW of live capacity in H1 2026, with 1.4 GW under construction and 2 GW planned, but those figures combine Frankfurt, London, Amsterdam, Paris, and Dublin. They therefore indicate the scale of the competitive European market, not Frankfurt-specific inventory.
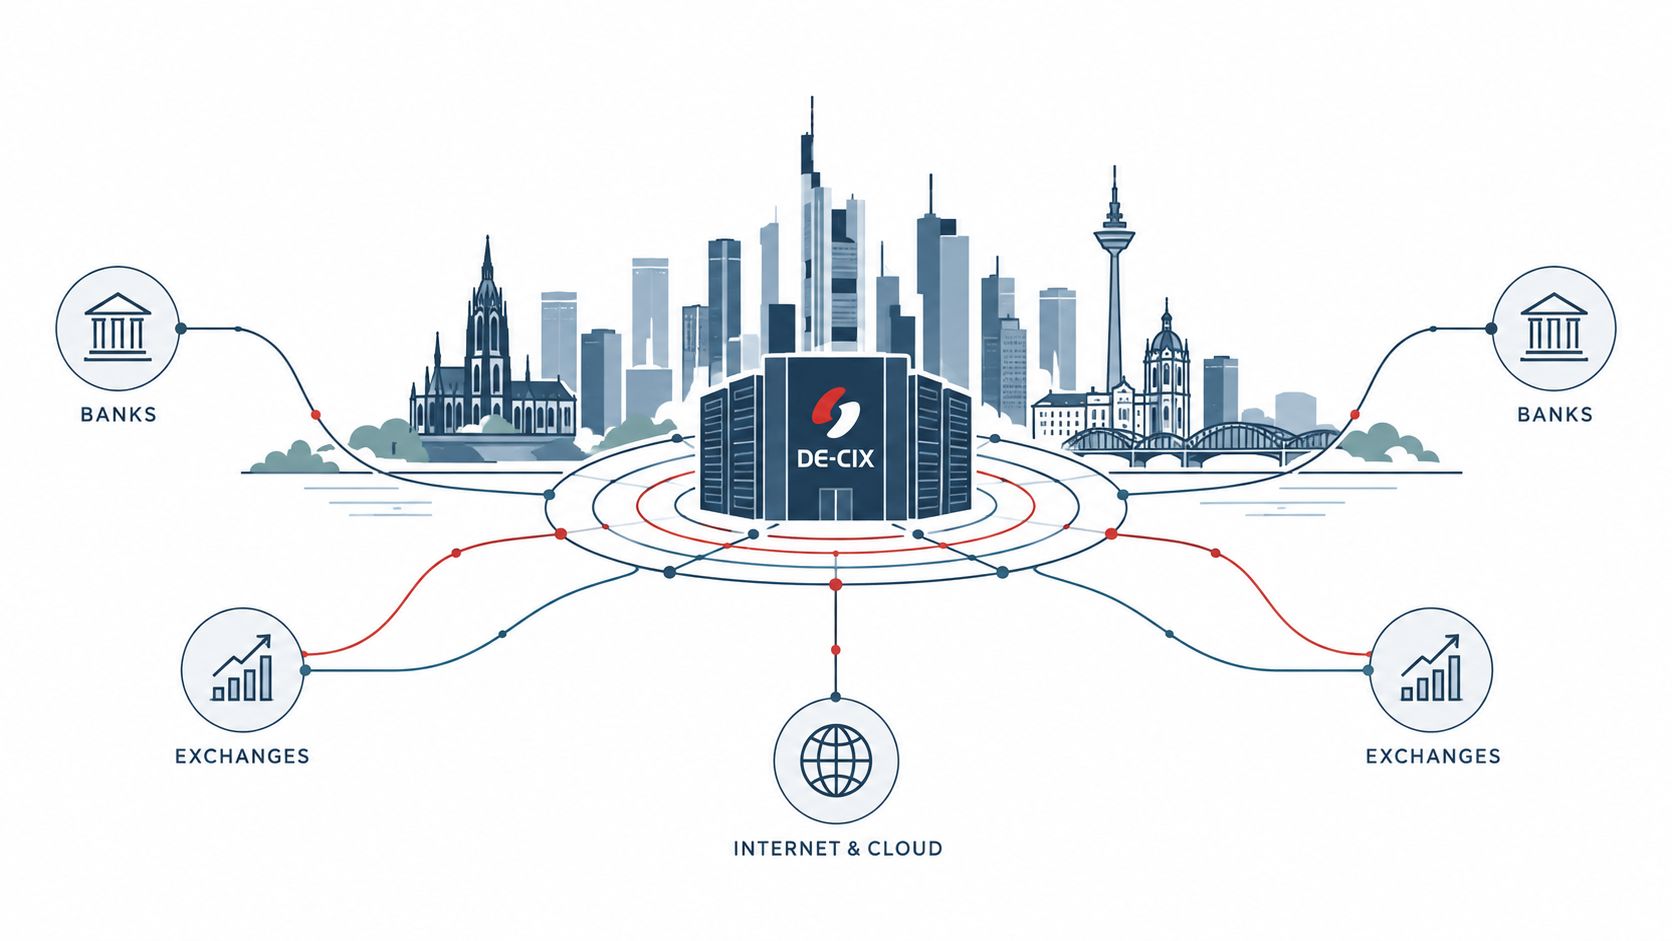
Frankfurt's capacity case is strongest when paired with network density. Financial institutions, cloud platforms, carriers, and enterprises can connect workloads across Europe through established peering, routing, and private-connectivity networks. A mature operator base also gives buyers choices among colocation facilities, carrier-rich sites, and larger deployments. Facility-level directories such as Brightlio can help separate disclosed IT power from estimated figures, but buyers still need to verify site conditions directly.
Interconnection changes the decision
A Frankfurt deployment may justify higher land or power costs when the workload depends on proximity to financial customers, exchanges, cloud on-ramps, and major Internet exchange infrastructure. A site close to these connections can reduce network complexity and improve partner access. Power availability, permitting, cooling requirements, and expansion land still determine whether that connectivity advantage can be delivered in practice.
Frankfurt is best understood as a connectivity-led market, not only a capacity ranking.
Site-selection teams should examine carrier diversity, cross-connect availability, customer concentration, and distance to relevant exchange infrastructure. Investors should separate operating colocation depth from speculative future supply. Planned capacity matters only when grid access, permits, construction status, and delivery timing support it.
Frankfurt fits low-latency financial services, European enterprise platforms, cloud connectivity, and workloads that depend on dense peering. Sustainability diligence should cover power sourcing, cooling design, renewable-energy commitments, and local water conditions. The investment case is ecosystem access, supported by verifiable capacity and delivery evidence, rather than a building alone.
4. London
London is a UK anchor for financial services, media, enterprise technology, and international connectivity. Its value comes from concentrated customers and established network relationships, supported by substantial colocation portfolios and the Slough cluster. That operator depth gives buyers multiple campus and deployment options, although available power and delivery timing still require facility-level verification.
London suits workloads that need European reach and a United Kingdom presence. Regulatory interpretation, data-residency policy, cross-border connectivity, and disaster-recovery design therefore carry more weight than headline capacity alone. A deployment serving UK customers may justify London even when a continental hub offers greater theoretical expansion.
A premium market with a specific purpose
London is most suitable when proximity to UK financial institutions, media companies, public-sector customers, and domestic enterprises outweighs power or occupancy costs. It can also operate as the UK node in a multi-market architecture, with continental locations extending coverage. That arrangement spreads geographic and regulatory exposure, while adding network, contracting, and support complexity.
The FLAP-D cluster added 194 MW in H1 2026. Paris contributed 72.5 MW and London 49 MW. These figures indicate recent regional delivery, but they do not establish London's currently available capacity, utility position, or expansion timetable.
Capacity scarcity makes London a market for disciplined underwriting. Investors should test whether demand is durable enough to support premium pricing and whether proposed supply has credible power and delivery paths. Operators can use Data Center List to compare active, planned, and under-construction facilities by status and operator, while validating disclosed IT power separately from AI-estimated figures.
The selection question is specific: does the workload require a UK anchor? If the answer is yes, London's customer access and connectivity can justify its constraints. If the answer is no, a continental market may offer a better fit for capacity-led expansion, provided the deployment can support UK users through its network and resilience design.
5. Tokyo
Tokyo is Japan's principal data center market and an established base for enterprise, financial, cloud, and domestic-residency workloads. Its operator depth includes global providers, telecommunications companies, and local specialists, giving customers several deployment routes and access to Japanese enterprises. That capacity supports organizations prioritizing local operating standards, partnerships, and customer proximity.
Tokyo serves a different role from Singapore. Singapore concentrates on Southeast Asian regional access, while Tokyo functions mainly as a Japan-focused anchor with wider Asia-Pacific connectivity. For workloads serving Japanese users, data residency, language, regulatory interpretation, and local support may outweigh the efficiency of consolidating infrastructure in a broader regional hub.
Resilience belongs in the first screen
Seismic exposure makes resilience part of initial site selection. Buyers should assess building standards, redundancy, backup locations, fuel logistics, carrier diversity, and geographic separation before choosing a facility. A low-latency primary site still requires recovery capacity outside the same physical risk zone.
Interconnection and cloud access also need facility-level review. Data Center List can help compare operator portfolios, facility status, and stated IT power across Tokyo, while local diligence must confirm utility availability, land conditions, and expansion plans. Disclosed capacity should remain separate from AI-estimated IT power during underwriting, since the two measures carry different levels of certainty.
Tokyo fits Japanese data-residency requirements, financial-services connectivity, domestic enterprise systems, and Asia-Pacific strategies that need a strong Japan node. Its operator depth and customer access support deployment strategies built around service quality and local reach. The market is less suitable for organizations seeking large campuses with easily expandable power and limited site constraints. Investors should therefore price resilience, land, utility timing, and recovery architecture into the business case rather than treating them as later engineering work.
6. Singapore

Singapore is an Asia-Pacific gateway for cloud services, financial institutions, enterprise systems, and regional connectivity. Its telecommunications infrastructure, carrier ecosystem, regulatory stability, and geographic position support workloads that must reach several Southeast Asian markets from one regional node. Major international operators and cloud providers give the market meaningful operator depth, while its interconnection value extends beyond the power available within the city-state.
The investment case depends on separating gateway value from expansion capacity. Global vacancy remains tight, and power constraints are encouraging capacity growth in alternative locations, as noted in CBRE's global data center trends report. Those indicators do not measure Singapore's vacancy directly. They do show why an established gateway may require a paired-market strategy when additional power or land is difficult to obtain.
Gateway value versus expansion risk
Singapore fits latency-sensitive regional platforms, financial services, cloud access, and organizations seeking a recognized Southeast Asian operating base. Site reviews should cover power procurement, cooling design, water use, land availability, and expansion permissions. A secondary location can add future capacity, but the architecture must preserve carrier redundancy, consistent service levels, and workable operating governance.
Site-selection test: Choose Singapore for regional reach and interconnection density, then verify whether the required power and expansion path can be secured.
Data Center List provides a facility-level comparison between Singapore, Tokyo, Sydney, and other Asia-Pacific markets. Underwriting should keep disclosed IT power separate from AI-estimated power, then test how each figure affects available capacity and expansion timing. Investors should assess whether scarcity supports existing assets or redirects growth to neighboring markets. Operators should map regional exchange access, cross-connect availability, customer concentration, and recovery options before committing to a large footprint.
7. Amsterdam
Amsterdam ranks highly for interconnection value rather than sheer installed capacity. Its location between the United Kingdom and continental Europe, dense carrier access, and major internet-exchange ecosystem support cloud access, enterprise connectivity, and regional redundancy. The city can function as a European primary node or as a companion site to Frankfurt, London, Dublin, or Paris.
That positioning creates a distinct investment case. Buyers may select Amsterdam because it provides efficient access to several customer and network regions, even when another hub offers more available power. The trade-off is local execution risk. Planning approvals, utility capacity, water use, environmental rules, and flood exposure should be assessed alongside rack and connectivity requirements.
Compare Amsterdam by deployment purpose
Amsterdam, Frankfurt, and Dublin serve different workload priorities. Frankfurt may suit finance and dense peering, while Dublin may fit transatlantic and cloud-oriented deployments. Amsterdam offers a balanced European network position for organizations that need interconnection flexibility across multiple regions. These distinctions guide screening, but facility-level diligence must determine actual capacity, delivery timing, and expansion rights.
Regional capacity has expanded substantially, according to industry estimates cited earlier. That trend supports continued demand, but it does not establish Amsterdam's individual inventory. Data Center List's facility-level directory helps separate disclosed IT power from AI-estimated power, giving investors a clearer basis for comparing operating and planned capacity. Each estimate should be tested against current disclosures, grid commitments, and permitting status.
AMS-IX access, carrier redundancy, cooling design, flood resilience, and water-stress exposure belong in the shortlist review. Planned projects may offer early entry, provided grid connections and permits are credible. Amsterdam fits deployment strategies that prioritize European interconnection and geographic balance over a single-market hyperscale campus. For investors, the key question is whether connectivity premiums and operator depth compensate for local sustainability and expansion constraints.
8. Sydney
Sydney is Australia's primary data center market and the clearest local anchor for workloads serving Australia and New Zealand. Its importance comes from demand location rather than global scale. Domestic cloud regions, enterprise systems, financial services, and public-sector workloads often require local processing to control latency, regulatory exposure, resilience design, and customer experience.
The market has a mature operator base spanning global providers and local specialists. That depth supports deployment choice, but Sydney's geographic isolation also raises the value of power availability, carrier diversity, and recovery planning. Organizations serving New Zealand can use Sydney as a regional base, although the architecture must account for international connectivity and a separate disaster-recovery location where required.
Renewable energy and redundancy
Sustainability should be assessed through facility-level evidence. Site reviews should test renewable-energy procurement, grid composition, cooling efficiency, water use, backup generation, and access to additional power. A sustainability statement carries limited investment value unless it connects to a facility, contract, or operating practice.
Sydney's practical fit is strongest for Australian residency, domestic customer proximity, and Oceania coverage. Its distance from Asian and other global hubs creates higher dependence on international cable routes and deliberate recovery geography. Carrier diversity therefore affects both service continuity and asset risk, since a regional disruption can extend beyond one building.
Data Center List's map and facility directory distinguish active, planned, and under-construction assets and show where operators are concentrated. The distinction between disclosed IT power and AI-estimated IT power also gives investors a more consistent basis for judging current inventory and future capacity. Those records still require checks against grid commitments, permits, delivery schedules, and expansion rights.
Sydney should be compared with Singapore and Tokyo by workload latency, residency, customer location, interconnection requirements, and recovery distance. Planned projects add value when they create genuine geographic or carrier redundancy. Projects clustered along the same constrained corridor may increase concentration instead.
Sydney is a market for regional necessity. It suits a resilient Australian footprint, while investment cases depend on transparent expansion assumptions and verified redundancy.
9. Paris
Paris is a distinct European option for French data residency, public-sector systems, regulated workloads, and organizations prioritizing national control over data location. Its operator base includes global providers, domestic infrastructure companies, and sovereign-cloud initiatives, giving buyers more than a purely hyperscale-led deployment model. The shortlist should therefore reflect workload sensitivity, jurisdiction, provider depth, and expansion requirements.
Paris contributed 72.5 MW to FLAP-D capacity additions during H1 2026, the largest contribution among the five markets in that period, according to Brightlio's H1 2026 data. The figure measures cluster-level additions rather than Paris's full installed inventory. It nevertheless signals an active role in European capacity growth and supports consideration of Paris for future deployments.
Sovereignty changes the shortlist
Paris suits French enterprises, government workloads, regulated data, and companies that need a national anchor inside the European Union. It can also form one node in a wider European design with Frankfurt, London, Amsterdam, or Dublin. The site decision turns on whether French residency is mandatory or EU-based processing is sufficient. That distinction changes the value of local facilities, interconnection, and recovery locations.
Capacity growth does not remove delivery constraints. Buyers still need facility-level checks on grid access, renewable procurement, cooling design, water use, planning rules, certifications, contract terms, physical security, and operator maturity. Data Center List helps compare operator portfolios, facility status, and planned projects, while providers must confirm delivery schedules and expansion rights directly.
Paris is better suited to jurisdictional fit combined with growing regional capacity than to a deployment requiring immediate, highly flexible campus expansion without verified grid access. For investors, its differentiated demand can support an expanding-market thesis. For operators, the practical opportunity is targeted capacity aligned with French residency and regulated workloads, rather than a generic substitute for every European hub.
10. São Paulo
São Paulo is Latin America's principal data center gateway for cloud services, financial systems, enterprise workloads, and regional digital infrastructure. Its installed base and continuing project pipeline give Brazil a substantial domestic platform, while carrier access extends its value beyond national demand. The market therefore serves two strategies: local processing for Brazilian customers and a regional base for services reaching neighboring countries.
Those strategies require different site criteria. Domestic deployments should prioritize residency, latency, utility performance, and regulatory fit. Regional platforms need broader carrier diversity, international route redundancy, expansion land, and recovery options outside the metropolitan area. São Paulo's operator depth supports multiple deployment models, but capacity should be assessed at facility level rather than inferred from the city's overall prominence.
A regional anchor with local complexity
Political and economic conditions belong in the investment model, but physical diligence determines whether planned capacity can be delivered. Buyers should verify utility reliability, power availability, connectivity routes, backup systems, security procedures, operator capabilities, and expansion rights. International redundancy must be contracted and tested, because a regional design can fail when cross-border routes are assumed rather than confirmed.
Data Center List's Ascenty São Paulo facility profile illustrates how a specific site can be assessed alongside market-level capacity. Facility records help separate disclosed IT power from AI-estimated figures and clarify differences in location, status, and operator capability across the metropolitan area.
São Paulo is a strong fit for Brazilian enterprise workloads, regional cloud services, financial platforms, and Latin American expansion. It is less suitable as a single-site resilience strategy where recovery objectives require geographic separation. Investors should distinguish operating facilities from planned and under-construction capacity, assigning value to future projects only after power, permits, delivery milestones, and expansion rights are substantiated. For deployment teams, the practical choice is between immediate local access and a wider regional design that adds a second location for continuity.
Top 10 Global Data Center Markets Comparison
| Market | Implementation complexity | Resource requirements | Expected outcomes | Ideal use cases | Key advantages |
|---|---|---|---|---|---|
| Northern Virginia (Loudoun County) | Medium, mature ecosystem but land/power competition raises complexity | Very high power & fiber; cooling/water management critical | Massive scale, low-latency US gov/enterprise access, high interconnection | Hyperscale cloud regions, government, finance, large colocation | Largest capacity in NA, dense interconnection, proximity to Washington D.C. |
| Dublin, Ireland | Medium, streamlined approvals but constrained grid/land | High power, transatlantic fiber, water-sensitive cooling | Strong EU market entry with GDPR-compliant hosting and hyperscale growth | EU cloud gateway, data residency, hyperscale deployments | GDPR/data residency advantage, transatlantic routes, tax incentives |
| Frankfurt, Germany | Medium, high interconnection focus, premium site requirements | Very high fiber/peering capacity, reliable power, moderate cooling needs | Exceptional peering and low-latency EU connectivity | Financial services, trading platforms, interconnection-focused workloads | DE-CIX peering density, carrier ecosystem, central EU position |
| London, United Kingdom | Medium–High, premium market, regulatory uncertainty post-Brexit | High power and redundancy, dense fiber; limited premium land | Strong financial services demand, premium pricing, robust UK coverage | Banking/trading, media, UK-based enterprise services | Leading UK financial hub, mature operators, strong international links |
| Tokyo, Japan | High, strict seismic/disaster standards increase complexity | High power, advanced cooling, resilient seismic infrastructure | High-quality operations, strong domestic financial and enterprise access | Japanese data residency, finance, mission-critical enterprise | Mature standards, strong peering, local tech/manufacturing talent |
| Singapore | Medium, government support but land/water constraints | High power, limited water, dense fiber and IXPs | Regional APAC gateway with low-latency reach across Asia | APAC cloud gateway, regional enterprise deployments | Strategic location, interconnection density, regulatory stability |
| Amsterdam, Netherlands | Medium, growing market with favorable cost dynamics | Moderate power, strong fiber diversity, flood/water mitigations needed | Cost-effective EU presence with good connectivity and peering | Cost-sensitive EU deployments, AMS-IX peering strategies | Lower costs vs Frankfurt/Dublin, AMS-IX, carrier diversity |
| Sydney, Australia | Medium, supportive policy but geographic isolation affects complexity | Moderate power, expanding fiber links, focus on renewables | Regional Oceania coverage, emerging capacity for local cloud services | Australia/NZ market entry, sustainability-focused deployments | Gateway for Oceania, renewable energy initiatives, government support |
| Paris, France | Low–Medium, emerging market with government incentives | Moderate power, growing fiber, emphasis on renewable sourcing | French/EU data sovereignty hosting, growing domestic market | Public sector, French enterprises, sovereignty-sensitive workloads | Government-backed sovereignty initiatives, favorable incentives |
| São Paulo, Brazil | Medium, developing market with regulatory and political variables | Moderate power, improving international fiber, local infrastructure needs | Latin America gateway with growing hyperscale and enterprise demand | Regional LATAM deployments, localized cloud and enterprise services | Largest LATAM market, cost advantage, strong local demand |
Turn Market Rankings Into a Site Decision
A market ranking becomes useful only after the deployment objective is explicit. Latency-sensitive trading, a domestic public-sector database, AI training, and distributed inference each assign different weight to proximity, power, network access, residency, resilience, and expansion room. Site selection should therefore begin with workload requirements, not a city's aggregate capacity.
Separate operational capacity from future capacity. Active facilities indicate what may support deployment now. Planned and under-construction sites represent possible supply, with greater delivery uncertainty. In constrained markets, delivery schedules can extend to 2027 and beyond, as noted in CBRE's global data center trends report. Treat a project as available only after utility access, planning approval, construction progress, and commissioning evidence support that conclusion.
A repeatable evaluation sequence
- Define latency and residency: Map users, applications, data locations, and recovery requirements before comparing markets.
- Separate current and pipeline supply: Review active, planned, and under-construction facilities independently. Test whether proposed projects have credible power and delivery paths.
- Verify power feasibility: Confirm utility capacity, connection timing, procurement structure, backup generation, and expansion rights.
- Map connectivity: Assess carriers, Internet exchanges, cloud on-ramps, subsea routes, cross-connect access, and physical route diversity.
- Test regulatory fit: Match data-residency, sovereignty, security, and sector obligations to the workload.
- Assess water and community conditions: Review water stress, cooling needs, noise, employment, planning requirements, and local impact.
- Model expansion and recovery: Estimate the cost and timing of adding capacity, relocating workloads, and operating a geographically separate recovery site.
Data Centers List applies facility-level filters for markets, operators, status, and IT power, alongside facility profiles and map-based water-stress context. Its directory covers 6,052 sites across 175 countries, according to Data Centers List platform data, and distinguishes disclosed or AI-estimated IT power. That distinction gives analysts a clearer basis for separating reported capacity from modeled estimates.
The same dataset supports operator and market comparisons, including planned and under-construction visibility. That view can reveal future competition, identify overlooked supply, and show where a market's apparent scale depends heavily on projects that have not reached operation. Available local information on water use, power consumption, noise, and jobs adds sustainability and community considerations to a capacity review. Community-sourced updates are checked against public sources, but buyers should validate material assumptions with operators, utilities, authorities, and engineering advisers.
A strong shortlist often includes several markets with different strategic roles. Northern Virginia can suit scale-driven deployments, Singapore can support regional access, Paris can address sovereignty requirements, and São Paulo can anchor Latin American expansion. The preferred market depends on workload, delivery confidence, interconnection value, operator depth, sustainability constraints, and the organization's tolerance for cost or execution risk.
Use the ranking to frame the decision, then compare facilities within each candidate market. That final step converts a global capacity view into a site choice with documented assumptions, verification tasks, and a defensible deployment rationale.