Largest Data Centers in Texas: 10 to Know
Explore the largest data centers in texas, ranked by capacity and footprint, with operators, status, regional context, maps, and local impacts.
20 min read
Texas now has data center projects measured at the scale of power systems, not merely buildings. The largest operating site identified in a 2026 industry tracker is Riot Platforms' Rockdale facility at 700 MW, while the largest planned project listed by the same tracker reaches 5,778 MW. A separate market tracker identifies a planned Amarillo project at 11,000 MW. These figures aren't directly comparable, because a ranking can mix individual campuses, multi-site portfolios, cloud regions, and projects that may still be years from energization. (Cleanview's Texas tracker; US Data Map's Texas market view)
This list therefore separates operating facilities from pipeline projects, distinguishes disclosed capacity from AI-estimated figures, and labels whether an entry describes one campus, a portfolio, or a broader regional footprint. The ranking uses the supplied IT-power estimates where available, then interprets what each location means for connectivity, power procurement, land, water, and community impact.
Dallas-Fort Worth remains the state's most mature connectivity and colocation center. Austin and San Antonio form a growing technology corridor, Houston serves enterprise and network demand, and West Texas offers large land positions alongside a distinct renewable-energy and water context. For buyers and analysts, the Data Center List interactive directory and map provides a practical way to compare capacity-scaled markers, operating status, planned facilities, operator records, and water-stress overlays. Real estate investors assessing digital infrastructure can also connect this analysis with broader work on navigating cap rates in commercial real estate.
Table of Contents
- 1. Switch SuperNAP Texas
- 2. Digital Realty DFW Data Center Campus
- 3. CyrusOne Data Center Portfolio
- 4. Equinix IBX Facilities
- 5. Cyxtera Data Centers
- 6. QTS Data Centers
- 7. Google Data Center Regions
- 8. Microsoft Azure Data Centers
- 9. AWS Data Centers
- 10. Emerging Hyperscale and Purpose-Built Facilities
- Top 10 Texas Data Centers Comparison
- How to Read Texas's Data Center Map
1. Switch SuperNAP Texas
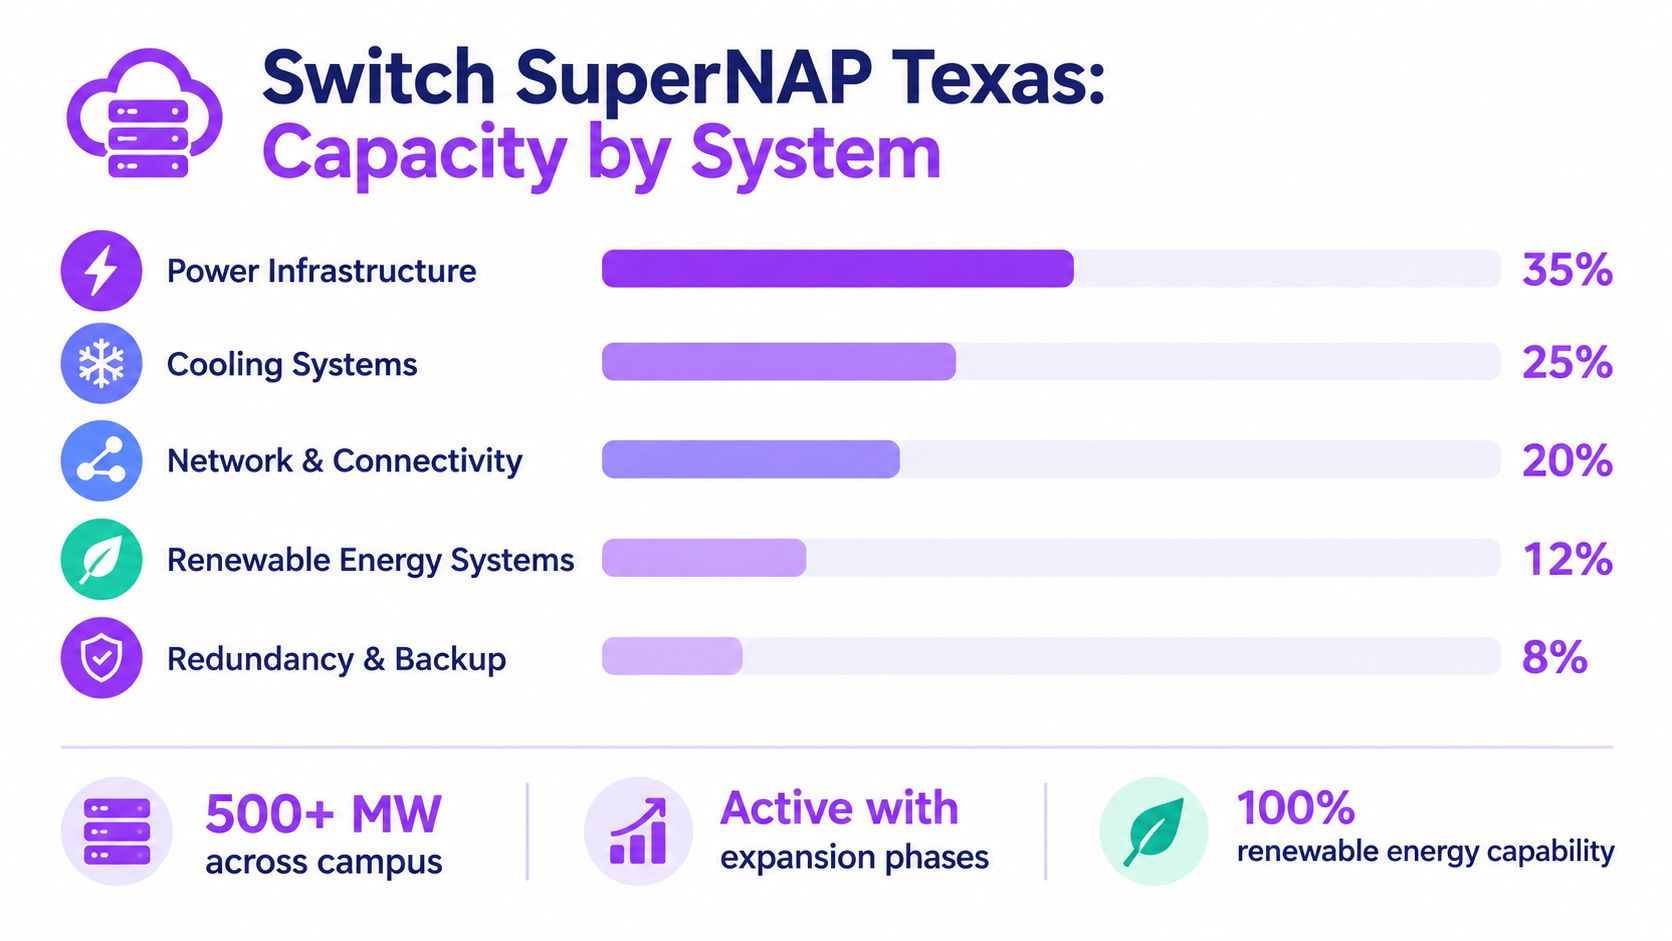
Switch SuperNAP Texas belongs near the top of any qualitative ranking of the largest data centers in Texas, even though the supplied evidence doesn't provide a verified MW figure for this specific campus. Its importance comes from its Dallas-Fort Worth position, campus-style design, and role as a large-scale colocation environment rather than from a publicly confirmed capacity number.
The DFW location places the campus near a dense enterprise base and a broad carrier ecosystem. That combination matters for financial services, healthcare, cloud connectivity, content delivery, and other workloads where network paths can be as important as floor space. A large colocation campus can also support different customer profiles in the same operating environment, from major cloud customers to regional businesses that need managed infrastructure.
Why the campus model matters
A multi-building campus gives operators more room to separate maintenance zones, power systems, and customer deployments. It also creates a more useful expansion conversation than a single-building listing. Buyers should ask how much capacity is currently commissioned, how much power is reserved, and whether expansion depends on utility delivery, internal buildout, or both.
Practical rule: A large campus name isn't the same as available capacity. Site selectors should verify commissioned power, delivered power, and the date when additional capacity can actually be occupied.
Summer power conditions deserve special attention in Texas. A customer evaluating Switch should review power commitments during peak periods, carrier interconnection options, cooling design, and the treatment of renewable-energy claims in sustainability reporting. Those questions are more useful than relying on a headline campus label alone.
For context, Switch's Nevada presence is documented in the Switch Las Vegas data center listing. The comparison is useful because it reinforces the need to evaluate each campus by local power, network, and expansion conditions rather than assuming that one operator's sites are interchangeable.
2. Digital Realty DFW Data Center Campus
Digital Realty's Dallas-Fort Worth presence is best understood as a campus portfolio, not one universally comparable building. The supplied information doesn't disclose a single verified IT-power figure for the portfolio, so its rank reflects market role and campus scope rather than a precise MW placement.
The DFW market gives Digital Realty's facilities strategic value because enterprises often need more than basic server space. Financial services organizations may prioritize cross-connect availability and direct access to cloud networks, while healthcare providers may focus on security controls, operational continuity, and compliance requirements. Those needs make interconnection density and network diversity central parts of the site-selection decision.
Evaluate connectivity before capacity
A customer comparing facilities should identify the carriers, cloud on-ramps, and cross-connect options available in the specific building. Campus-wide branding can obscure meaningful differences between facilities, especially when one building has a stronger network ecosystem or a different expansion schedule.
Direct cloud connection programs can help organizations design hybrid environments without placing every workload in the same facility. A business may also use separate buildings within a broader campus strategy, but only if the buildings have independent power and network paths.
The Digital Realty DFW data center listing gives analysts a facility-level reference point. That distinction matters because portfolio-level claims can make a provider look larger than any individual site is. For a realistic comparison, buyers should record the building, operator, status, available power, and interconnection options separately.
3. CyrusOne Data Center Portfolio
CyrusOne's Texas footprint spans Austin, Dallas, and Houston, making it a portfolio rather than a single-campus entry. The supplied evidence doesn't provide one verified aggregate MW figure for all of these facilities, so the portfolio shouldn't be treated as directly equivalent to a single hyperscale campus or a utility-scale planned project.
The geographic spread is the main analytical advantage. A customer with operations across Texas may use separate markets for redundancy, disaster recovery, or workload placement. Dallas-Fort Worth offers the deepest established data center ecosystem in the state, Austin connects to a technology-heavy business corridor, and Houston brings a major enterprise and network market with a different customer base.
The Allen example shows the scale difference
CyrusOne's Allen, Texas campus is described by the operator as the largest data center campus in Texas, with more than 90 acres and 77 MW of total IT capacity across its DFW3 and DFW4 facilities. DFW5 functions as a land bank for future development, which means the campus represents both current capacity and expansion optionality. (CyrusOne's Allen campus profile)
That example shows why a Texas ranking needs to distinguish a completed facility from a multi-phase campus. The 77 MW is a disclosed campus figure, while the land bank signals future development without proving that future power has been delivered. It also illustrates why suburban Texas locations can compete effectively for hyperscale-style growth, with land and expansion space that dense urban markets may not offer.
The CyrusOne DAL1 listing provides a facility-level lens. Enterprises should request sustainability metrics, cooling information, and the actual redundancy design for each site rather than applying portfolio-level assumptions to every building.
4. Equinix IBX Facilities
Equinix's Texas presence includes interconnection-focused IBX facilities in Houston and Dallas-Fort Worth. No verified aggregate IT-power estimate is supplied for these facilities, so capacity alone can't place the portfolio cleanly beside the named hyperscale projects. Its significance lies in the network ecosystem that customers can access through the sites.
An interconnection facility serves a different purpose from a large single-tenant hyperscale campus. Global banks may value direct access to financial networks, content delivery networks may use a hub architecture for regional distribution, and enterprises may place connectivity-sensitive systems close to multiple carriers and cloud providers. The facility can therefore be strategically important even when its power capacity is smaller than a remote, purpose-built campus.
Network density changes the buying decision
A site selector should examine provider diversity, cloud connectivity, cross-connect procedures, and the operational process for provisioning new connections. Equinix's software-defined infrastructure approach can support organizations that need to manage connections across regions, but the practical value depends on which providers are present in the specific Texas facility.
The DFW and Houston locations also create a regional design choice. DFW may suit organizations seeking access to the state's largest established data center cluster, while Houston can provide a distinct enterprise and network position. Disaster recovery planning should verify that the two sites don't share the same power, carrier, or geographic failure dependencies.
5. Cyxtera Data Centers
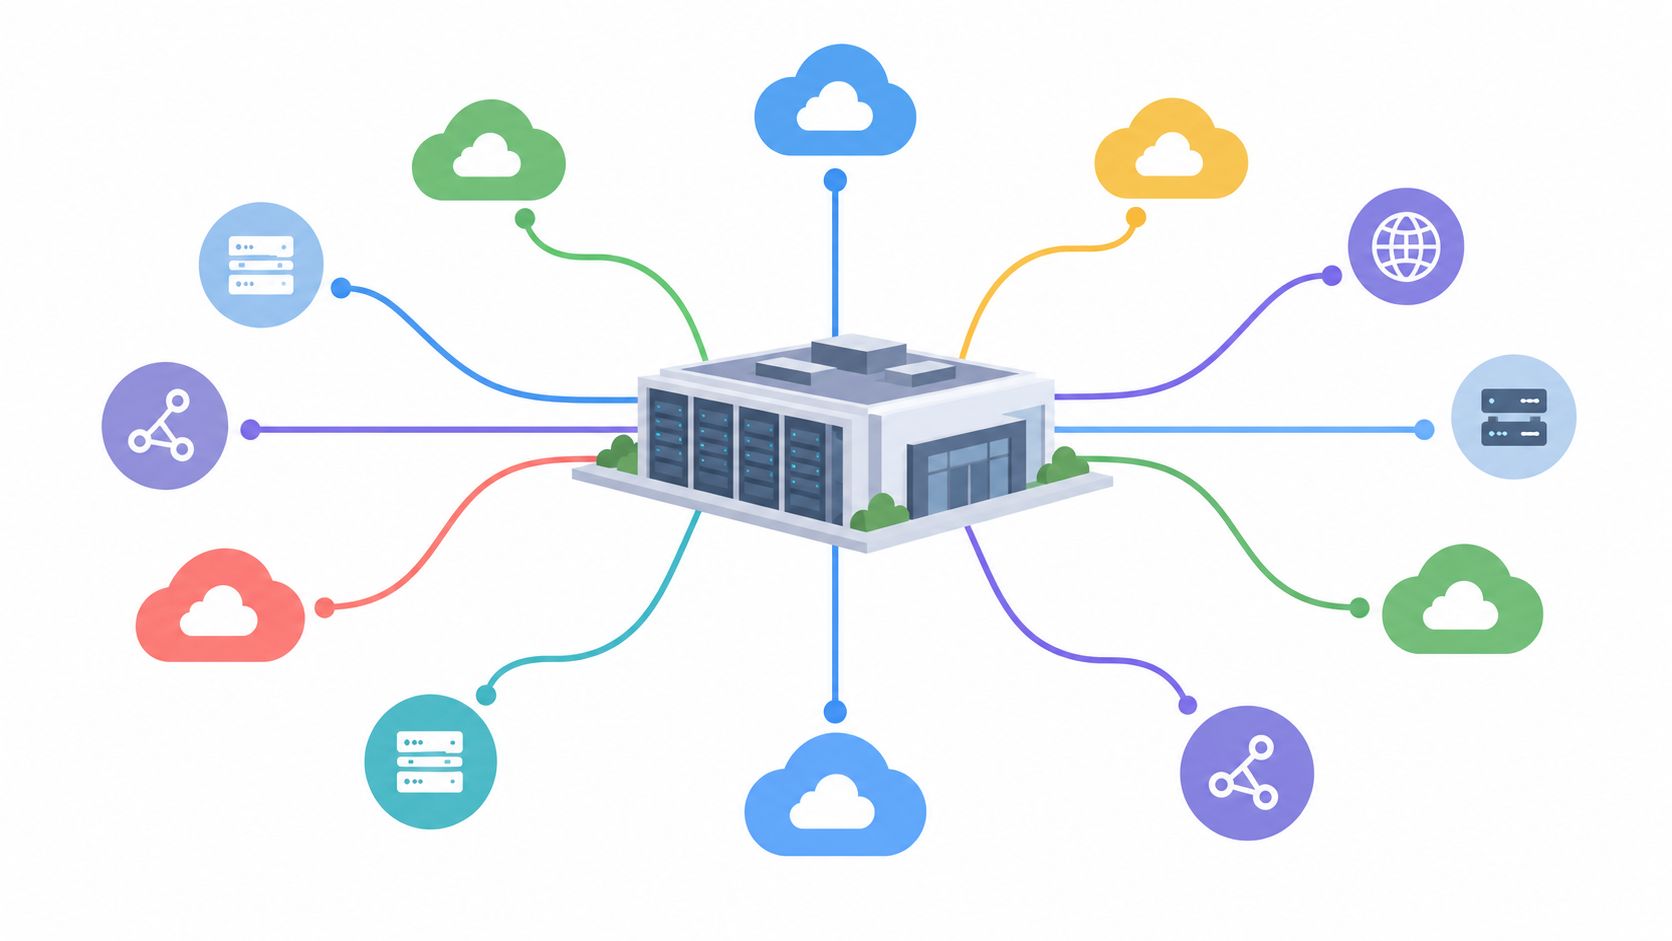
Cyxtera's Texas presence covers the Dallas and Houston markets, with an emphasis on enterprise colocation and carrier-neutral infrastructure. The supplied data doesn't provide a verified MW figure, so this entry shouldn't be presented as a capacity winner. Its relevance comes from serving organizations that need flexible deployment options, regional support, and connectivity choices without building a private facility.
Dallas and Houston offer different operating contexts. Dallas-Fort Worth provides access to a deep concentration of data center providers and networks, while Houston's enterprise base supports workloads tied to energy, healthcare, logistics, professional services, and other regional industries. A customer with distributed operations may value both markets, but the right design depends on latency, carrier paths, compliance requirements, and recovery objectives.
Fit matters more than a headline ranking
Mid-market enterprises often need help with migration sequencing, hardware installation, network changes, and capacity planning. Local support can matter during those projects, particularly when an internal IT team lacks the staff to coordinate every physical task. Flexible contract terms can also help a growing company avoid locking its infrastructure plan to an uncertain expansion schedule.
Before selecting a facility, buyers should:
- Map carrier requirements: Confirm that the facility supports the specific network providers and routes needed for production traffic.
- Separate facility claims: Verify whether redundancy applies to power, cooling, network entrances, or all three.
- Plan for growth: Ask when additional space and power can be delivered, rather than treating contracted capacity as immediately usable.
- Review compliance evidence: Request the actual controls and certifications relevant to healthcare, finance, or other regulated workloads.
That approach places Cyxtera in its proper category. It may be a strong enterprise infrastructure choice without being directly comparable to a multi-gigawatt planned campus.
6. QTS Data Centers
QTS's Austin-San Antonio corridor position connects the operator to one of Texas's most visible technology growth zones. The supplied material doesn't provide a verified IT-power number for these facilities, so the entry is ranked by regional relevance and development role rather than by a disclosed capacity estimate.
Austin brings technology companies, startups, software providers, and research-driven businesses. San Antonio adds a larger operational and enterprise base, along with a history of data center activity. Together, the corridor can support workloads that need central Texas access while avoiding a decision based solely on Dallas-Fort Worth's established cluster.
Central Texas creates a different trade-off
A startup or regional SaaS provider may value managed services, deployment support, and room to expand without operating a private data center. A larger enterprise may instead use the corridor as one location in a hybrid design, pairing colocation with public cloud services and on-premises systems.
The corridor also needs a careful power and water review. A growing technology market can attract demand quickly, but site selectors still need facility-specific information on utility capacity, cooling systems, water sources, and local permitting. Austin and San Antonio aren't interchangeable, and a regional label shouldn't replace a building-level assessment.
For Latin America-facing workloads, central Texas can be considered alongside latency testing and carrier-route analysis. Geography alone doesn't guarantee a suitable network path. The operational question is whether a selected site offers the carriers, cloud connections, managed services, and expansion schedule required by the workload.
QTS therefore represents a regional growth option rather than a verified capacity leader. Its place in the list shows why rankings based only on MW can miss the practical value of a technology corridor serving different customer types.
7. Google Data Center Regions
Google's West Texas data center presence represents a hyperscale cloud and consumer-services model, but the supplied evidence doesn't provide a verified site-level IT-power figure. The facilities should therefore be read as a regional cloud footprint, not as one building that can be ranked directly against a named operating campus.
West Texas changes the site-selection equation. Large land positions can support extensive campuses, while the region's energy environment creates opportunities to evaluate renewable procurement and dedicated infrastructure. Those advantages come with connectivity and water questions that buyers shouldn't overlook. A cloud region's usefulness depends on workload latency, network access, service availability, and the operator's regional architecture, not only on land or energy.
Hyperscale scale can hide local distinctions
Google Cloud workloads, Search, and YouTube services may use infrastructure differently from an enterprise colocation deployment. An enterprise choosing a cloud region cares about service availability, data governance, network performance, and recovery design. A physical site visitor may care about construction, power delivery, cooling, and community effects. These are related but different analytical lenses.
Renewable-energy claims also require precision. A company evaluating sustainability goals should examine the operator's documented energy accounting and the relationship between renewable procurement and the facility's actual power consumption. “Renewable context” doesn't automatically answer questions about local transmission, backup generation, or water use.
West Texas can support large-scale development, but scale creates responsibility for local review. County planning, water availability, road impacts, workforce needs, and grid interconnection all shape whether a hyperscale site can expand smoothly. A map-based comparison helps expose that regional context instead of reducing the entry to a cloud brand and a large but undisclosed capacity assumption.
8. Microsoft Azure Data Centers
Microsoft's Texas footprint includes Azure facilities across multiple regions, including West and North Texas. The supplied plan doesn't provide a verified aggregate capacity for those sites, so this entry describes a broad cloud infrastructure presence rather than a single ranked campus.
Azure's value for enterprises often comes from regional cloud availability and hybrid integration. Organizations can connect existing systems to Azure services, place regulated or latency-sensitive workloads in an appropriate region, and use cloud capacity without managing the underlying facility. Financial services and other regulated industries still need to examine service controls, data residency, network architecture, and contractual requirements rather than assuming that a Texas location resolves every compliance question.
Pecos shows why planned capacity needs its own category
Microsoft announced a new Pecos campus that would add approximately 2 GW of global data center capacity, according to the company's 2026 announcement. The project is described as a future buildout over five to seven years, so the figure represents planned capacity and shouldn't be treated as current live load. (Microsoft's Pecos data center announcement)
The announcement also describes dedicated energy infrastructure at launch and closed-loop cooling plans intended to limit ongoing water requirements. Those design statements are important, but they remain project-specific commitments rather than proof that every Microsoft facility in Texas uses the same approach.
For enterprise planning, the practical questions are region availability, service dependencies, network latency, capacity timing, and the distinction between announced and energized infrastructure. An Azure region can be operationally valuable even when its physical campus isn't publicly ranked by a single disclosed MW number.
9. AWS Data Centers
AWS operates multiple cloud infrastructure regions in Texas, but the supplied evidence doesn't provide a verified aggregate IT-power estimate for those facilities. That makes AWS another portfolio-level entry. It represents broad cloud capacity and service reach, not one directly comparable colocation building.
Customers using AWS may include large enterprises, startups, and software providers that run production systems on cloud infrastructure. The physical data center location matters, but the customer experience also depends on region architecture, availability-zone design, edge connectivity, service selection, and recovery planning. A public cloud region therefore shouldn't be ranked as though it were a single leasable hall.
Cloud scale requires workload-level analysis
An organization evaluating AWS should map production, backup, and disaster recovery workloads separately. Cost monitoring tools can reveal inefficient resource use, while reserved purchasing models may suit predictable workloads. Those decisions affect the customer's cloud bill and resilience design, but they don't establish the physical capacity of the Texas facilities serving the workload.
Network design deserves equal attention. Edge locations and content delivery paths may matter more than the nominal distance to a region for customer-facing applications. A company serving users across Texas, the United States, or international markets should test actual latency and route performance rather than relying on a regional label.
The same distinction applies to sustainability and community review. A cloud operator's corporate energy commitments don't replace facility-level questions about power delivery, cooling, water, backup generation, and local permitting. AWS belongs on a list of the largest data center presences in Texas because its infrastructure is distributed and cloud-oriented, but a facility ranking needs site-level evidence before assigning a precise position.
10. Emerging Hyperscale and Purpose-Built Facilities
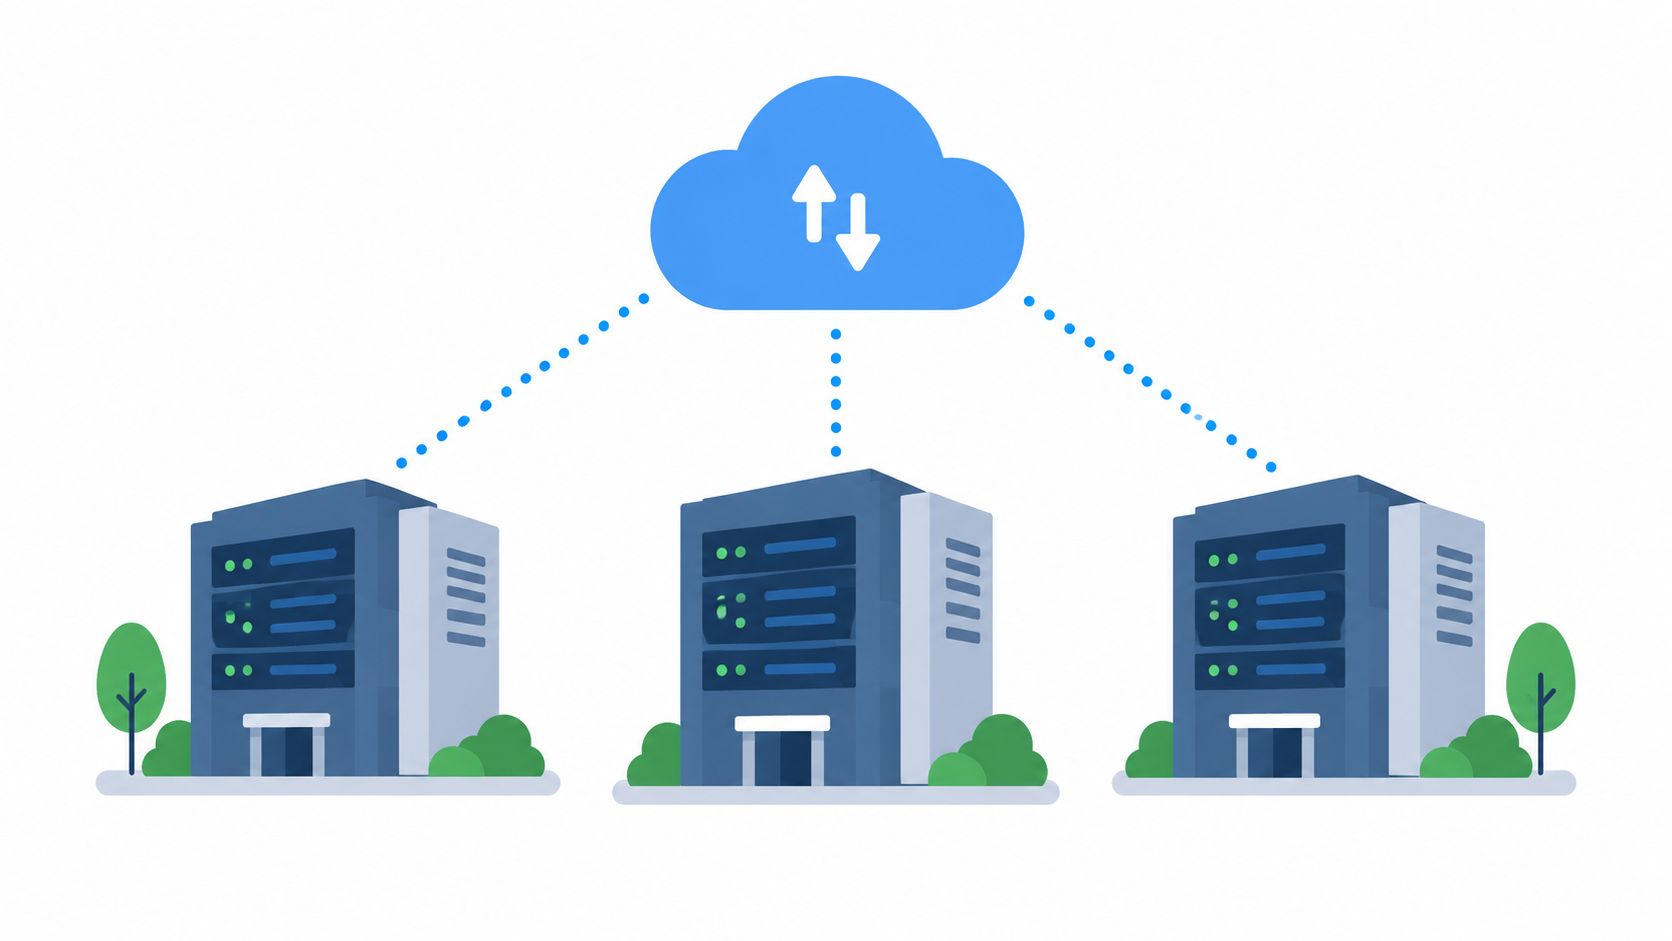
The pipeline is now the most disruptive part of the Texas ranking. A 2026 industry tracker lists 104,292 MW of total Texas capacity, divided into 7,169 MW operating and 97,123 MW planned. The same tracker lists Riot Platforms' Rockdale site at 700 MW as the largest operating data center and Fermi America's Project Matador, Expansion Gas, at 5,778 MW as the largest planned project.
Another tracker identifies an active site at 1,400 MW, along with planned campuses including an 11,000 MW Amarillo project and a 2,000 MW Microsoft campus in Pecos. Those figures are tracker estimates or reported project capacities, not a uniform set of disclosed IT-power measurements.
The leaderboard can change before projects go live
Texas reporting describes 335 existing data centers and at least 248 more in development, while another 2026 tracker counts about 140 planned projects totaling more than 75,000 MW. The discrepancy reflects different definitions, coverage, and methodology. It also proves why “largest” is a moving category shaped by announcements, permits, phases, and energization dates. (Texas Tribune's data center guide)
A planned multi-gigawatt campus can dominate headlines long before it contributes meaningful operating load. Buyers should ask for the first energization date, utility commitment, cooling design, and construction phase. Communities should ask how power, water, roads, noise, taxes, and emergency services will be affected.
Top 10 Texas Data Centers Comparison
| Facility | Implementation complexity | Resource requirements | Expected outcomes | Ideal use cases | Key advantages |
|---|---|---|---|---|---|
| Switch SuperNAP Texas (Dallas-Fort Worth Region) | High, multi-building, phased hyperscale campus | Very high power (500+ MW), advanced cooling, renewable sourcing | Hyperscale capacity with low regional latency | Hyperscale cloud, CDNs, large enterprises | 100% renewable capability, strong interconnection, scalable campus |
| Digital Realty DFW Data Center Campus | Medium–High, modular, multi-campus deployments | High power (300+ MW), diverse utility feeds, carrier ecosystem | Enterprise-grade reliability and dense interconnection | Enterprise colocation, finance, healthcare, multi-provider strategies | Large carrier marketplace, proven uptime, global platform integration |
| CyrusOne Data Center Portfolio (Austin, Dallas, Houston) | Medium, multi-city portfolio focused on efficiency | High power (400+ MW), low PUE, renewable integration | Sustainable, reliable colocation with multi-city options | Sustainability-conscious enterprises, multi-city redundancy | Strong sustainability credentials, competitive pricing, operational consistency |
| Equinix IBX Facilities (Houston and DFW) | High, interconnection-heavy, SDN/API-enabled operations | High power (250+ MW), extremely high network density | Maximum interconnection and global platform access | Network providers, global enterprises, exchanges/CDNs | Unmatched carrier density, GNC integration, API-driven provisioning |
| Cyxtera Data Centers (Dallas and Houston) | Medium, regional, customer-centric colocation | Moderate power (200+ MW), on-site support teams | Responsive regional colocation and DR capabilities | Mid-market enterprises, regional healthcare, local cloud providers | Local management, flexible contracts, carrier-neutral architecture |
| QTS Data Centers (Austin‑San Antonio Corridor) | Medium, modular power and managed-service focus | Moderate power (150+ MW), managed services available | Scalable regional support with access to tech talent | Startups, regional SaaS, LATAM-facing services | Proximity to Austin ecosystem, managed services, competitive regional costs |
| Google Data Center Regions (West Texas Industrial Sites) | Very high, custom hyperscale design with advanced automation | Very high (GW+), large renewables, water recycling and advanced cooling | Massive compute capacity, high efficiency, sustainable ops | Google Cloud customers, large-scale consumer services, AI workloads | Abundant renewables, AI-driven ops, custom hardware at scale |
| Microsoft Azure Data Centers (Multiple Texas Regions) | Very high, multi-region AZ architecture and integrated services | Very high (GW+), renewable commitments, AI-ready infrastructure | Enterprise cloud integration with AZ redundancy and AI support | Hybrid cloud, enterprise apps, regulated workloads, AI/ML | Deep Azure ecosystem, availability zones, enterprise SLAs |
| AWS Data Centers (Multiple AWS Regions in Texas) | Very high, multi‑AZ hyperscale with broad service catalog | Very high (GW+), extensive compute/storage/network and edge sites | Broad, highly available cloud services for diverse workloads | Startups to Fortune 500, SaaS, global applications | Largest service catalog, operational maturity, compliance & partner ecosystem |
| Emerging Hyperscale & Purpose‑Built Facilities (Pipeline Projects) | High (variable), purpose-built for next‑gen workloads | Planned very high power (1000+ MW pipeline), modern cooling (liquid/free) | Next‑generation efficiency and tailored capacity for AI/GPU | AI/ML clusters, GPU farms, long‑term committed capacity buyers | Latest technologies, design flexibility, potential early-stage pricing advantages |
How to Read Texas's Data Center Map
No single facility deserves the universal title of Texas's largest. Switch SuperNAP Texas leads the supplied qualitative campus ranking, while CyrusOne's Allen campus provides the clearest disclosed example of a large multi-phase Texas site, with 77 MW across DFW3 and DFW4 and additional land reserved for development. Riot Platforms' Rockdale site leads the supplied operating-capacity estimate at 700 MW, but that figure belongs to a different category from a colocation campus estimate. (CyrusOne's Allen campus profile)
Planned projects expand the gap further. Fermi America's listed project reaches 5,778 MW, while the separate tracker's Amarillo project reaches 11,000 MW. Neither figure should be read as current operating capacity. The useful comparison isn't a single winner. It's a structured reading of what each number represents, who disclosed it, and when the power may become usable.
A practical review sequence starts with classification:
- Check the evidence label: Determine whether the IT-power figure is operator-disclosed, publicly reported, or AI-estimated.
- Define the asset: Confirm whether the number covers one building, a campus, an operator portfolio, a cloud region, or a project pipeline.
- Filter by status: Separate active, under-construction, and planned facilities. A planned campus isn't a substitute for available live capacity.
- Test the regional fit: Compare carrier access, cloud connections, latency, utility delivery, land, and expansion conditions across Dallas-Fort Worth, Central Texas, Houston, and West Texas.
- Review local constraints: Examine water stress, cooling systems, permitting, grid requirements, community infrastructure, and any available jobs or local-impact information.
Water deserves its own review rather than a footnote. A University of Texas white paper estimated that Texas data centers could be associated with 25 billion gallons of water use in 2025. Its analysis estimated indirect grid-related requirements averaging 87 gallons per kWh of withdrawal and 0.96 gallons per kWh of consumption, with annual consumption for mid-sized and large facilities ranging from 12 million to 660 million gallons. (University of Texas water requirements white paper)
Those figures are estimates and should not be assigned to every facility. They do show why cooling design, water source, drought conditions, and local permitting can determine whether a large project is practical. A site with abundant land may still face power-delivery or water constraints, while a smaller interconnection hub may have a stronger business case because it serves network demand without requiring the same physical expansion.
The Data Centers List directory gives analysts a way to investigate these differences through facility profiles, capacity-scaled map markers, status filters, operator views, sortable tables, and water-stress overlays. Its records distinguish disclosed from AI-estimated IT power and include operating, planned, and under-construction facilities. Public facility information can change as operators, planners, utilities, and local authorities release updates, so the directory should support ongoing verification rather than replace it.
Texas's data center map is most useful when it shows both opportunity and friction. Dallas-Fort Worth offers mature connectivity and colocation depth. Central Texas offers technology-market access. Houston adds enterprise and network diversity. West Texas offers land and hyperscale potential, while increasing attention to power procurement, cooling water, transmission, and community impact. The largest project on paper may not be the easiest project to energize, lease, or support locally.
Data Centers List provides a searchable directory, capacity-scaled map, status filters, operator views, and local context for active and planned facilities. Analysts comparing the largest data centers in Texas can use those tools to verify each site's category and follow market changes, so visit Data Centers List to explore the Texas map and current facility records.