10 Large Data Centers and What They Reveal
Explore 10 large data centers worldwide by capacity, operator, design, and market role, with practical lessons for infrastructure operators and investors.
21 min read
The biggest mistake in evaluating large data centers is assuming the largest campus is automatically the best asset, the best market, or the best operator signal. Size matters, but size alone hides the variables that drive returns and operational risk: usable IT power, whether capacity is disclosed or estimated, whether the site is active or still in planning, how power is sourced, how cooling is designed, and whether the local grid and water system can absorb more load.
That lens matters more now because the scale gap inside the sector has widened sharply. The International Energy Agency notes that large hyperscale data centres typically require 100 megawatts or more, versus roughly 5 to 10 MW for an average data centre, and that some next-generation campuses under construction can demand about 20 times the electricity of a typical facility. That isn't just a bigger building. It's a different infrastructure class with different permitting, substation, cooling, and community exposure.
For operators and investors, the useful question isn't “which site is biggest?” It's “which archetype fits the market, workload, and constraint set?” A multi-tenant urban colo, a GPU-heavy build in a power-rich region, and a modular edge deployment can all be rational choices for different reasons.
That's where Data Center List becomes useful as a comparison tool rather than a rankings page. It lets readers compare active, planned, and under-construction facilities across markets, while keeping disclosed capacity separate from AI-estimated figures instead of blending them into a false precision. Used that way, facility profiles become signals about market maturity, bottlenecks, and deployment strategy.
Table of Contents
- 1. Hyperscale Cloud Provider Data Centers
- 2. Colocation and Managed Services Facilities
- 3. Edge Data Centers
- 4. Regional Data Center Clusters
- 5. Renewable Energy-Powered Data Centers
- 6. Specialized Purpose-Built Data Centers
- 7. Government and Mission-Critical Data Centers
- 8. Secondary and Emerging Market Data Centers
- 9. Modular and Prefabricated Data Centers
- 10. Sustainability and Carbon-Efficient Data Centers
- Large Data Centers: 10-Type Comparison
- Turn Facility Profiles Into Decisions
1. Hyperscale Cloud Provider Data Centers
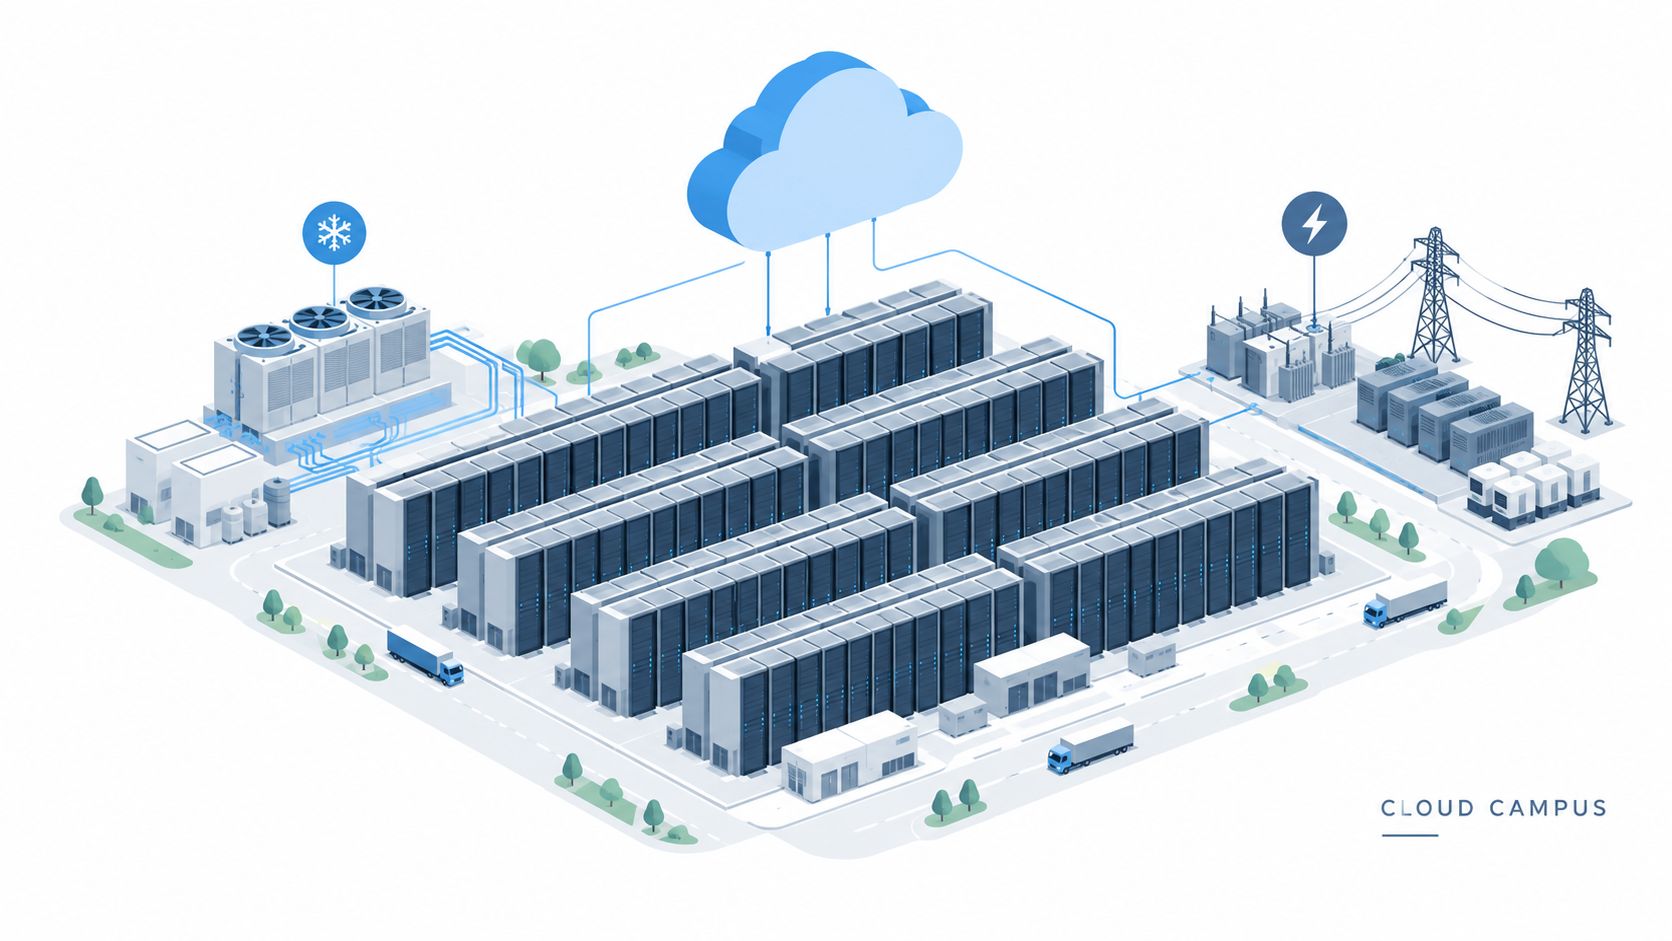
Hyperscale cloud campuses set the pace for the rest of the market. Facilities linked to AWS, Microsoft Azure, Google Cloud, and Meta aren't just larger than conventional enterprise sites. They're built around regional control of power, land, network routes, and long-term expansion options.
Examples vary in design and geography. Google's U.S. campuses in Council Bluffs and The Dalles show how operators anchor around durable infrastructure, while Meta's sites in Sweden and Ireland reflect the role of climate and energy sourcing. Google's Elmina Business Park facility profile is the kind of listing that helps separate operator presence from assumptions about actual live capacity.
What the archetype reveals
The operating logic is scale first, flexibility second. Once a hyperscaler enters a market, it tends to think in clusters, procurement pipelines, and utility relationships rather than single-building economics.
That approach looks stronger today because global data centre electricity demand has expanded quickly. In 2024, data centres consumed about 415 TWh worldwide, or roughly 1.5% of global electricity use, after growing by 12% per year over the previous five years. For a hyperscaler, that means future advantage comes less from finding server rooms and more from securing electricity and interconnection before rivals do.
Hyperscale strength usually shows up before a hall opens. Land banking, utility filings, and multi-site regional presence often matter more than marketing language.
A reader comparing markets should watch for three signals:
- Regional depth: Multiple campuses in one metro usually signal confidence in power and fiber access.
- Status mix: Active plus under-construction assets say more than a single announced flagship.
- Disclosure quality: A market with many estimated MW values may still be investable, but it needs extra validation from planning and operator disclosures.
2. Colocation and Managed Services Facilities
Size alone can mislead here. A 20 MW carrier-dense urban colo and a 20 MW enterprise-heavy managed facility can sit in the same market yet produce very different margins, upgrade costs, water exposure, and expansion options.
The business model explains why. Colocation and managed services operators sell shared infrastructure to multiple tenants, not capacity to one internal platform. That broadens demand but makes the asset harder to run. Power reservation, cooling design, compliance requirements, cross-connect density, and contract duration all vary by customer type.
Two facilities with similar advertised capacity can therefore have different investment quality. One may have strong network gravity and low vacancy risk but limited mechanical headroom for AI racks. Another may have weaker interconnection value today yet better economics for high-density deployments because the halls, power chain, and cooling plant were designed for retrofit or selective liquid cooling from the start.
Where the pressure is building
The current strain is density mix, not just occupancy. The Uptime Institute's 2026 Global Data Center Survey reported an industry-average PUE of 1.52, while average modal rack density exceeded 11 kW for the first time; excluding a small number of very high-density facilities, modal density was 7.8 kW, up from 7.5 kW in 2025. For colo operators, that combination matters because incremental efficiency gains look harder to capture while tenant power intensity keeps rising.
That changes how large facilities should be read. Older metro assets still matter because latency, carrier presence, and enterprise proximity support sticky demand. But those same sites often face tighter water limits, smaller footprints for yard expansion, and harder generator or substation upgrades. Newer campuses in exurban markets usually have more room to add substations and high-density halls, but they may trade away some interconnection premium and deployment certainty if the market is less mature.
For readers comparing this archetype across markets, three signals usually matter more than headline floor space:
- Disclosed versus estimated capacity: A footprint with many estimated MW figures may indicate real presence, but it gives less confidence on near-term revenue capacity than facilities with clearly disclosed live or contracted power.
- Mechanical upgrade path: Facilities that can segment halls by density class, add liquid cooling selectively, or expand utility intake have a clearer route to AI demand than assets that depend on full-building retrofits.
- Resource exposure: Urban resilience can be strong, but water constraints, permitting friction, and backup power compliance can slow upgrades and raise capex more than the base building size suggests.
The broader pattern is useful across the ten archetypes in this article. Colocation strength comes from optionality, but optionality is not free. It usually requires more complex operations, more phased capital spending, and more careful reading of whether a facility's stated capacity reflects installed infrastructure, contracted load, or marketing-stage potential.
3. Edge Data Centers
Edge facilities often look small next to hyperscale campuses, but that's the wrong comparison. Their value comes from location and latency, not absolute MW. A dense urban edge node can matter more to a content, inference, or telecom workload than a much larger remote campus.
AWS Local Zones, Microsoft telecom partnerships, Google Distributed Cloud Edge, Vapor IO, and regional operators such as EdgeConneX show the pattern. The EdgeConneX Toronto North York facility illustrates how edge deployments should be read in context: metro adjacency, network role, and deployment status matter more than raw square footage.
The real constraint is local friction
Edge projects face a different set of trade-offs than large rural campuses. They usually move faster on proximity but slower on land assembly, neighborhood acceptance, municipal utility coordination, and urban cooling design.
The archetype is strongest where operators need low-latency distribution, metro redundancy, or local data handling. It's weaker when the workload can tolerate distance and would be cheaper in a power-rich exurban market.
Practical rule: Edge expansion is often easier to see in status changes than in headline announcements. A shift from planned to under construction in several secondary metros can be more meaningful than one flagship launch.
Useful signals include under-construction counts in tier-2 cities, telecom adjacency, and whether the operator is repeating a modular design. In edge, replication usually matters more than individual site prestige.
4. Regional Data Center Clusters
Northern Virginia, Dublin, Frankfurt, Amsterdam, London, and similar hubs are less like single markets and more like infrastructure ecosystems. Their attraction comes from concentration: carriers, cloud on-ramps, skilled labor, contractors, and customers are already there.
That concentration lowers some risks and raises others. It reduces go-to-market friction because customers already buy there and suppliers already know how to build there. But it also intensifies competition for land, substation capacity, and political tolerance.
Mature clusters reward selectivity
The common mistake is treating every facility in a top cluster as equally advantaged. In reality, mature hubs split into three sub-markets: premium interconnection assets, expansion campuses with power optionality, and late entrants chasing a crowded market.
A large data center inside a famous cluster can still be the wrong asset if it lacks room for density upgrades or sits behind a weak utility path. Conversely, a planned project in a cluster may be highly attractive if it secures power earlier than peers.
- Ecosystem depth: Strong for customer acquisition, contractors, and network access.
- Constraint intensity: High for power queues, permitting scrutiny, and land cost.
- Investment reading: Cluster presence helps, but market entry timing and utility position matter more than address prestige.
Readers using quick-browse market views should compare operator concentration alongside status labels. If most future capacity appears tied to a small set of brands, the market may still grow, but bargaining power and expansion access may narrow.
5. Renewable Energy-Powered Data Centers
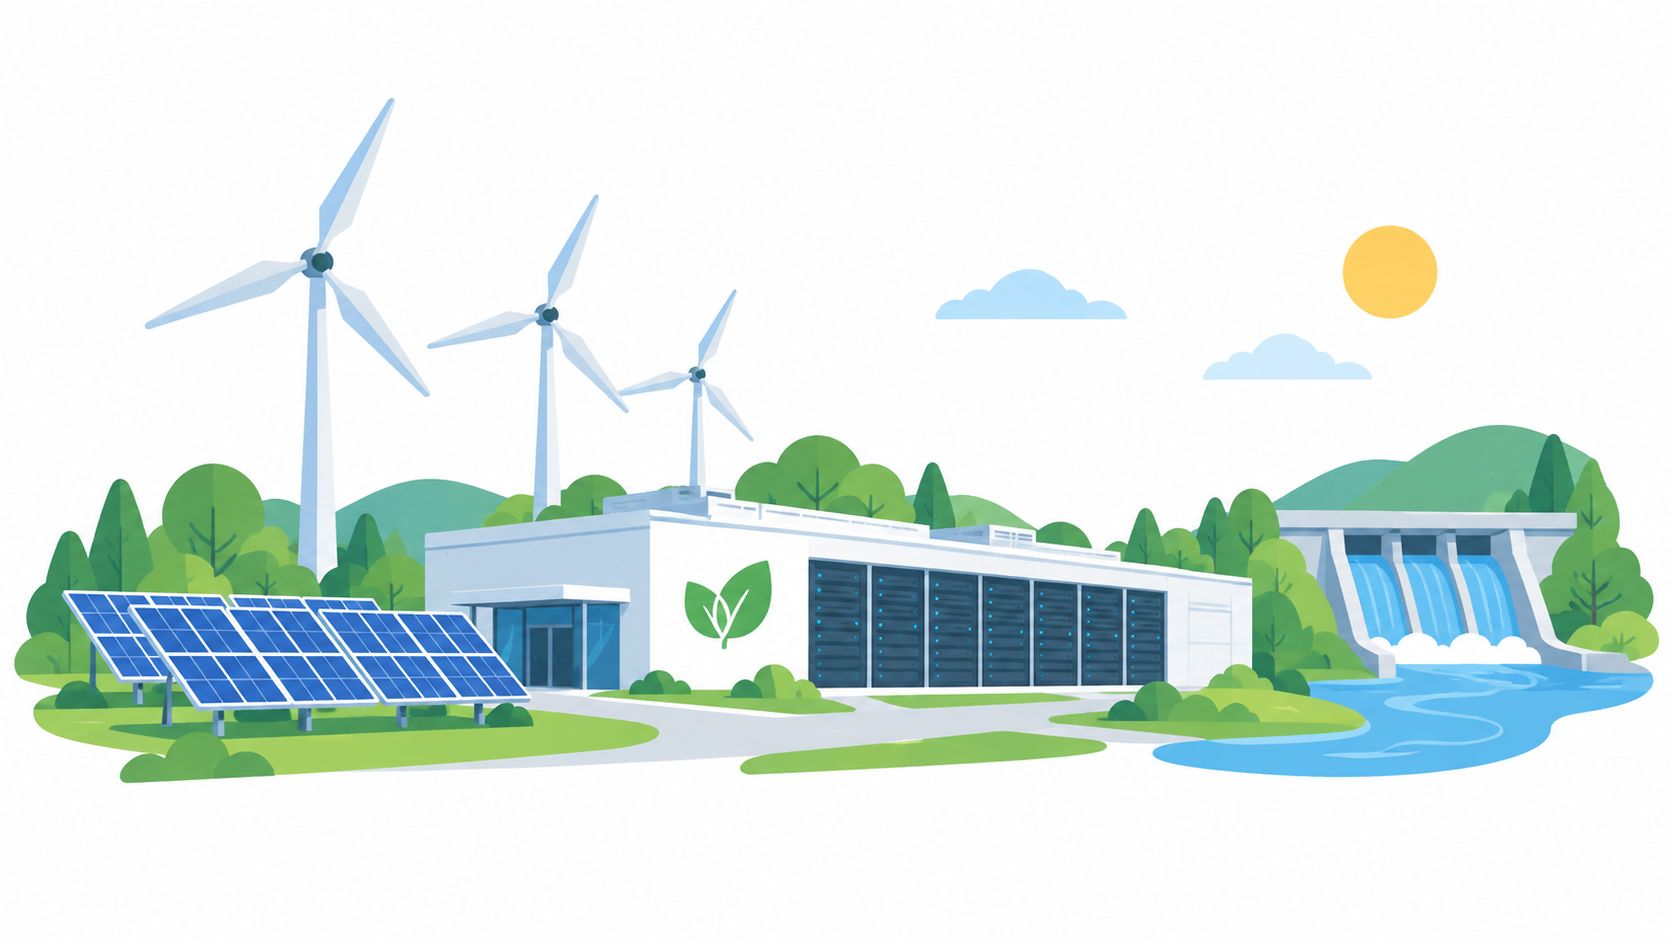
A renewable-powered site often looks simple on paper. Clean electricity, cooler climate, strong sustainability branding. Conditions matter more. Renewable alignment can improve long-term positioning, but it doesn't erase power-delivery constraints, curtailment risks, or local resource politics.
Facilities in Iceland, Sweden, Norway, the Pacific Northwest, and hydro-rich parts of North America show why this archetype remains attractive. Operators like Google, Meta, Microsoft, and Apple have all favored markets where renewable procurement is more credible and cooling conditions are naturally supportive.
Renewable supply doesn't remove infrastructure risk
This archetype works best when three conditions line up: dependable grid access, a believable clean-energy pathway, and enough distance from demand centers to avoid severe land and community friction. If one of those fails, the green narrative can outpace the actual operating advantage.
The most useful comparison isn't “renewable versus not renewable.” It's whether the site's energy strategy matches workload permanence. Long-duration cloud and enterprise demand can justify renewable-linked campuses. Shorter-cycle AI deployments may prioritize time-to-power over perfect energy matching.
A renewable-heavy market can still be a weak data center market if transmission, interconnection timing, or local approvals slow deployment.
That's why facility profiles should be read together with geography and status. Planned campuses in renewable-rich regions can be compelling, but only if the path from concept to energized capacity is visible.
6. Specialized Purpose-Built Data Centers
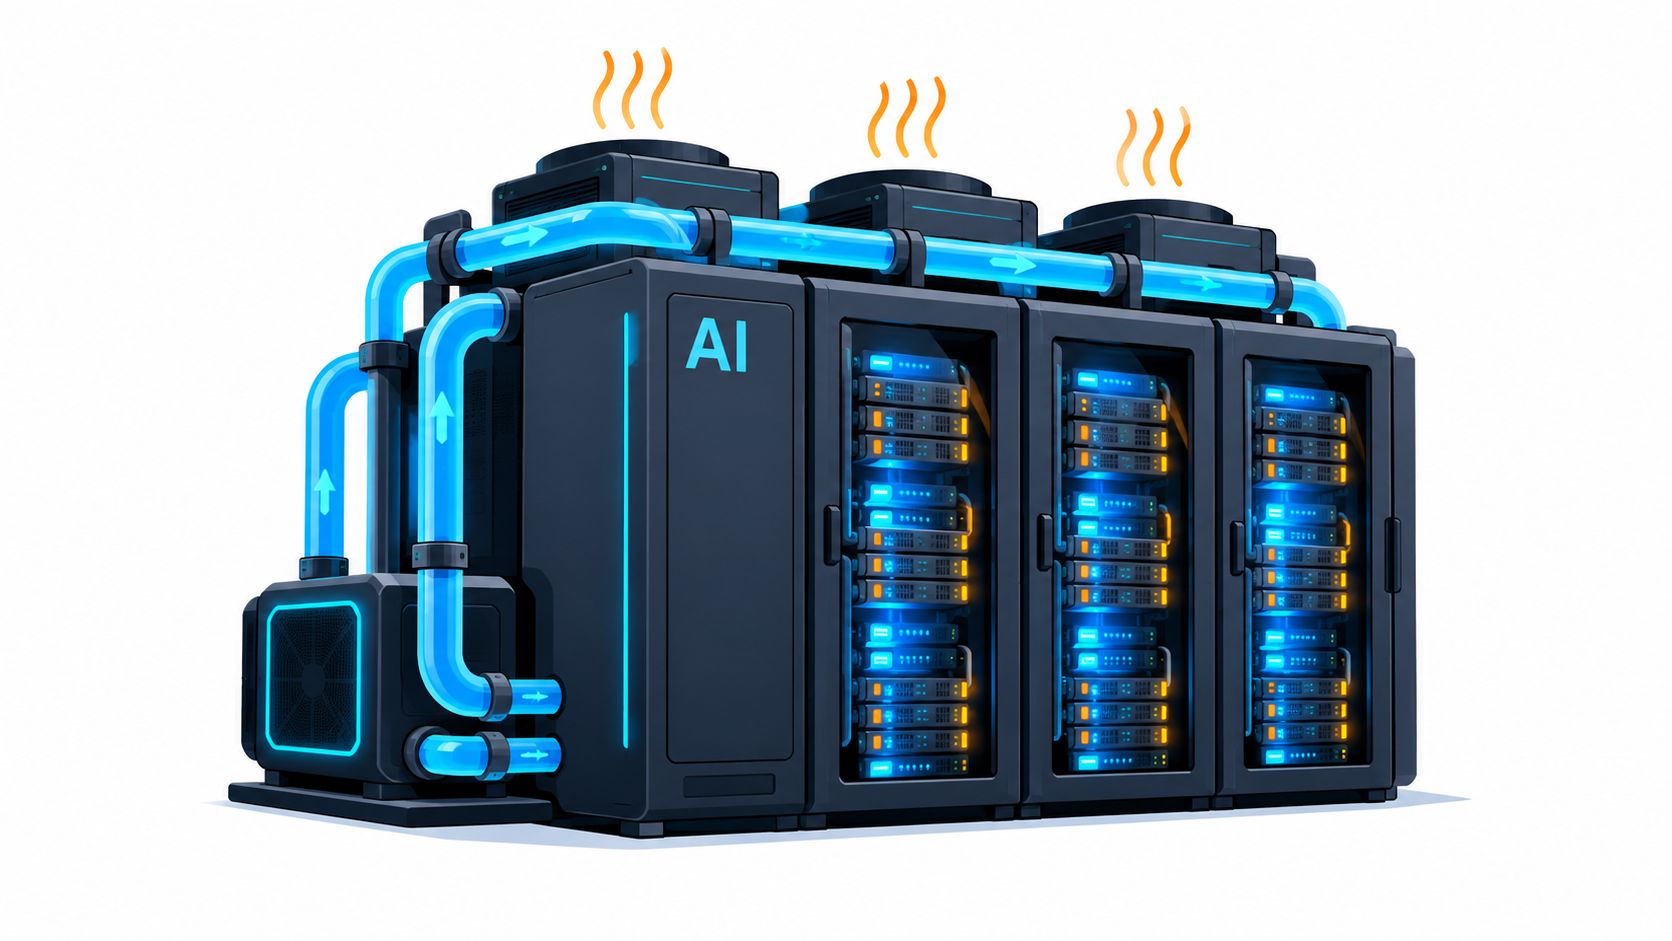
Specialized data centers make size a secondary metric. A 40 MW campus built for dense GPU clusters can matter more than a larger general-purpose facility because usable capacity depends on rack power density, cooling design, and upgrade speed, not just total square footage.
This archetype includes AI training sites, HPC environments, and custom halls built around unusual thermal or electrical profiles. Public examples include the High Performance Computing Center Stuttgart, where the facility profile reflects compute intensity and technical specialization more clearly than gross building scale.
The investment logic is different from standard colocation. Disclosed megawatts still matter, but estimated density, liquid-cooling readiness, substation headroom, and the operator's ability to reconfigure space often matter more. A large shell with conventional air cooling may still lease well for enterprise workloads while losing pricing power for advanced AI demand.
Gartner projected that global data center electricity consumption will reach 565 TWh in 2026, up from 447 TWh in 2025, with AI-optimized servers accounting for 31% of consumption and rising from 95 TWh to 175 TWh while conventional servers grow only modestly from 193 TWh to 195 TWh. That forecast matters less as a headline than as a design signal. Power growth is concentrating inside a narrower set of technically suitable buildings.
Readers evaluating this archetype should separate marketed AI readiness from physical capability. Facilities built for concentrated loads usually accept trade-offs that are easy to miss in headline capacity figures: higher mechanical complexity, tighter water management requirements in some cooling designs, and greater exposure to hardware-cycle volatility. In return, they can reach stronger revenue per MW and attract demand that generic space cannot serve.
Three signals tend to be more useful than a simple size ranking:
- Whether capacity is already energized or still planned through electrical upgrades.
- Whether the site was purpose-built for high-density deployment or retrofitted from conventional enterprise space.
- Whether the surrounding market can support repeat expansion without long utility delays or rising community opposition.
That is why this archetype is best read as a test of market maturity. Large specialized facilities do not just indicate compute demand. They reveal which markets can convert power, cooling, and deployment speed into investable capacity under tighter technical constraints.
7. Government and Mission-Critical Data Centers
Government and mission-critical facilities are often the hardest to compare because transparency is thinner by design. Security, redundancy, and compliance take priority over public marketing, and capacity disclosure is often partial or absent.
That makes methodology more important than ever. A directory that separates disclosed from estimated MW becomes especially useful in federal and defense-adjacent markets such as Washington, Arlington, or Colorado Springs, where public visibility is uneven.
Scarcity of disclosure is itself a signal
A government-focused facility may be highly resilient and strategically located, yet still be difficult to benchmark against commercial peers. In this archetype, readers should treat missing numbers as a feature of the segment, not necessarily a weakness in the asset.
The asset logic is different too. These facilities optimize for continuity, certification pathways, and controlled operating environments. Speed-to-market usually matters less than trust, procurement alignment, and long-term contract stability.
Operators in this segment often compete on assurance rather than scale. The strongest signal may be repeated presence in regulated markets, not headline campus size.
One adjacent operational lesson comes from industrial control environments, where downtime recovery planning is explicit rather than assumed. That's why references such as industrial VFD emergency response are useful conceptually, even outside the data center sector. Critical infrastructure operators tend to value recoverability and operating discipline as much as headline efficiency.
8. Secondary and Emerging Market Data Centers
Secondary and emerging markets attract attention whenever primary hubs become crowded, expensive, or politically difficult. But “emerging” doesn't mean immature in the same way everywhere. Some markets are driven by data residency rules, some by cloud region rollout, and some by the simple need for geographic redundancy.
Examples include India, Brazil, Mexico, Southeast Asia, the Middle East, and South Africa, along with tier-2 cities inside mature countries. These markets can offer cleaner entry points than saturated hubs, but they also expose operators to regulatory variation, less proven supply chains, and thinner labor pools.
Early entry can be advantage or burden
The upside is obvious. An operator that establishes presence before a market fills in can gain customer relationships, land optionality, and brand familiarity. The burden is that ecosystem depth may lag demand. Contractors, replacement parts, specialist cooling support, and experienced operations staff may not be as readily available.
That means market selection should separate demand drivers from delivery conditions. A market can have strong digital demand and still be difficult to build in at scale.
- Positive signal: Multiple operators moving from planned to active status in the same country.
- Caution signal: Heavy reliance on estimated capacity with limited planning transparency.
- Practical implication: First-mover advantage is strongest when regulation, fiber access, and utility coordination are all visible enough to underwrite.
For many investors, secondary markets are best viewed as portfolio diversifiers rather than simple substitutes for top-tier hubs.
9. Modular and Prefabricated Data Centers
Modular and prefabricated facilities appeal for one reason above all: deployment speed. They compress construction timelines by shifting more work into repeatable factory-built components, then assembling them on site with less design variation.
That makes them attractive for hyperscalers needing fast regional growth and for edge operators repeating compact node designs. Google, Meta, Microsoft, Baidu, and pod-style edge operators have all used modular concepts in different forms.
Standardization changes the risk profile
The appeal isn't only speed. Standardization can also reduce design uncertainty, support phased expansion, and make staffing and maintenance more consistent across sites.
But modular strategy has a trade-off. The faster the template, the more important local site fit becomes. A prefabricated design can still run into utility delays, water constraints, or permitting friction that the factory can't solve.
A useful way to read modular projects is by transition velocity. If an operator repeatedly moves sites from under construction to active with the same design language, that's a stronger capability signal than any one announcement.
For readers tracking these projects, speed-to-open modular projects offers a parallel lesson from adjacent development work. Repeatability matters, but local execution still determines whether speed survives contact with the site.
10. Sustainability and Carbon-Efficient Data Centers
A large data center can post efficient on-site metrics and still carry high environmental exposure. The gap usually sits off site, in grid carbon intensity, grid water intensity, and how much flexibility the operator has to shift load or change cooling strategy over time.
That changes how this archetype should be evaluated. Size alone says little. The stronger signal is whether the operator has built sustainability into siting, utility contracts, thermal design, and disclosure quality, because those factors affect operating cost volatility, permitting risk, and expansion options.
Water is the clearest example. On-site efficiency matters, but it is only one layer of the risk. A cooling system with low direct water use can still depend on electricity from a water-intensive generation mix, so two facilities with similar mechanical designs may have very different total resource exposure.
A useful reading is to separate three questions.
First, what is disclosed? Some operators publish power sourcing, water targets, and efficiency methods in enough detail to support comparison across regions. Others disclose little beyond renewable claims, which makes carbon and water performance harder to test.
Second, what is market-driven? Cleaner grids, cooler climates, and less stressed water basins can improve sustainability outcomes before any design optimization begins. That is why a mature market with tighter environmental constraints may still be lower risk than a faster-growth market with weaker resource fundamentals.
Third, what is flexible? Facilities designed for mixed cooling approaches, heat reuse where practical, or tighter workload management have more room to respond if power prices rise, water rules tighten, or customer reporting requirements increase.
For investors and operators, the decision signal is exposure, not branding:
- Lower-risk profile: transparent reporting, lower-carbon power access, lower water stress, and design choices that preserve operating flexibility
- Higher-risk profile: sustainability claims centered on procurement alone, limited local resource headroom, and little disclosure on water or grid dependence
This makes sustainability and carbon-efficient data centers less a standalone category than a filter across all ten archetypes. It helps distinguish markets where capacity can scale with fewer hidden environmental constraints from markets where growth may look attractive until power, water, or reporting pressure raises the cost of expansion.
Large Data Centers: 10-Type Comparison
| Type | Implementation Complexity | Resource Requirements | Expected Outcomes | Ideal Use Cases | Key Advantages |
|---|---|---|---|---|---|
| Hyperscale Cloud Provider Data Centers | Very high, custom design, long lead times, advanced automation | Massive capital ($500M–$2B), 100+ MW power, high water and network density | Large-scale capacity, low per-unit costs, rapid global scaling | Global cloud services, large enterprise workloads, bulk storage/compute | Economies of scale, continuous innovation, geographic redundancy, integrated stacks |
| Colocation and Managed Services Facilities | Moderate, multi-tenant operations, compliance and support workflows | 10–50 MW typical, redundant power/cooling, certified operations staff | Flexible tenant capacity, faster deployments than greenfield builds | Enterprises needing compliance, hybrid cloud, localized hosting | Lower capital for tenants, flexible leases, local support, compliance certifications |
| Edge Data Centers | Low–moderate, compact modular deployments, fast site turnaround | Sub‑MW to <10 MW, proximity to fiber/last‑mile networks, small footprints | Dramatically reduced latency, lower backhaul, rapid time‑to‑market | 5G, AR/VR, IoT, CDN, real‑time applications | Low latency, lower land costs, fast deployment, reduced network costs |
| Regional Data Center Clusters | High, coordinated ecosystems and interconnection planning | Multiple sites (20–100+), dense fiber, skilled workforce, metro power | High interconnection, mature markets, efficient supply chains | Interconnection-heavy services, financial services, regional cloud hubs | Network effects, mature supply chain, talent pool, transaction liquidity |
| Renewable Energy‑Powered Data Centers | High, site selection near renewables, integrate storage/grid backup | On‑site or contracted renewables, storage or backup, higher capex | Lower carbon footprint, sustainability reporting, potential long‑term price stability | ESG-focused enterprises, carbon‑sensitive workloads, green procurement | Aligns with sustainability mandates, brand/financing benefits, regulatory advantage |
| Specialized Purpose‑Built (GPU, HPC, AI) | Very high, custom power/cooling, specialized safety and networking | Extreme power density (20+kW/rack), liquid/immersion cooling, 400G+ interconnects | Highest compute density, premium pricing, rapid hardware refresh cycles | AI training/inference, HPC, crypto mining, specialized compute workloads | Optimized for compute‑intensive tasks, high margins, customer lock‑in |
| Government and Mission‑Critical Data Centers | Very high, strict security, compliance audits, classified controls | Secure infrastructure, redundant systems, cleared personnel, dispersed sites | Highly secure, resilient operations with long‑term contracts | Defense, classified data, critical infrastructure, regulated agencies | Stable funding/contracts, elevated security/compliance, low churn |
| Secondary and Emerging Market Data Centers | Moderate, adapt to local infrastructure and regulatory variability | 5–50 MW typical, growing fiber/power, regional partnerships, multi‑currency ops | Regional diversification, data‑residency compliance, growth potential | Data localization needs, regional enterprises, first‑mover market entry | Lower land/labor costs, government incentives, high local demand potential |
| Modular and Prefabricated Data Centers | Low–moderate, standardized factory fabrication, repeatable processes | Factory modules/containers, logistics, site prep, integrated systems | Rapid deployment (6–12 months), predictable costs, scalable replication | Rapid expansion, edge rollouts, temporary or urgent capacity | Fast time‑to‑market, lower construction risk, standardization and portability |
| Sustainability and Carbon‑Efficient Data Centers | High, advanced cooling, monitoring, and certification processes | Investment in liquid/immersion cooling, water recycling, AI ops, third‑party audits | Very low PUE (<1.1–1.2), reduced emissions, long‑term OPEX savings | Corporations with net‑zero targets, regulated industries, green financing seekers | Significant energy savings, ESG alignment, differentiation and access to green capital |
Turn Facility Profiles Into Decisions
The ten archetypes show why “largest” is a weak shortcut. Large data centers should be compared through a stack of operational facts: who operates them, whether the MW figure is disclosed or estimated, whether the site is active or still in development, how much local power headroom exists, what cooling path the design implies, how exposed the market is to water stress, and how deep the surrounding ecosystem already is.
That changes how facility profiles should be read. A hyperscale campus may signal long-term confidence, but it can also signal severe utility competition. A colocation site may look smaller, yet offer better customer optionality and faster monetization. A regional cluster may reduce execution risk because suppliers and customers are already present, while an emerging market site may offer stronger upside if regulation and utility access are stable enough to support expansion.
The disclosed-versus-estimated distinction is especially important. Disclosed capacity usually gives a firmer basis for underwriting operational scale, but estimated capacity still has analytical value when it's clearly labeled and not blended into false certainty. For planned and under-construction facilities, status often matters as much as MW because a delayed large site can be less useful than a smaller project with a realistic energization path.
Power now sits at the center of the decision stack. As noted earlier, the sector's expansion is increasingly constrained by access to electricity rather than by demand alone. Water should be assessed the same way. On-site cooling design matters, but so does the indirect water burden created by the local grid. A facility can look efficient inside the fence line while carrying heavier regional exposure than a less aggressively marketed peer.
A practical workflow follows from that:
- Filter by market and status: Separate active, planned, and under-construction sites before comparing scale.
- Check operator footprints: Repeated presence in a market usually says more than one large announcement.
- Compare MW carefully: Treat disclosed figures as firmer evidence and estimated figures as directional until validated.
- Review local context: Water-stress overlays, market density, and ecosystem depth help explain whether capacity is durable.
- Validate externally: Before any operating or investment decision, confirm important figures against operator statements, planning records, or other public disclosures.
Used this way, Data Centers List is less a rankings destination and more a screening layer. It helps narrow the field, identify where scale is real versus promotional, and show where infrastructure constraints may matter more than campus size. For operators and investors, that's the more useful question. Not which facility is biggest, but which large data center archetype best fits the market conditions behind it.
Data Centers List gives readers a structured way to compare active, planned, and under-construction facilities across markets, with operator details, MW capacity, and clear labeling of disclosed versus AI-estimated figures. Its map, rankings, and market views make it easier to screen large data centers by status, geography, and local context before deeper diligence begins. Explore Data Centers List to turn broad market interest into a more disciplined facility shortlist.