How to Do Benchmarking Research: A 2026 Guide
Learn how to do benchmarking research for data centers effectively. This guide covers scope, metrics, analysis, and presenting findings to optimize performance.
16 min read

A market analyst may be asked to benchmark a data center market such as Northern Virginia or Dublin before the underlying evidence is ready for a clean spreadsheet. Public announcements describe large campuses without specifying whether a figure refers to site power, total campus potential, or current IT load. One operator publishes detailed capacity information, another discloses only a project phase, and a third appears in planning records with no dependable power figure at all.
That's the normal starting point, not an exceptional failure. Benchmarking research is the disciplined process of turning uneven evidence into a comparable view of scale, efficiency, position, and future direction. The quality of the result depends less on collecting the largest possible dataset than on defining the comparison, labeling uncertainty, and resisting the temptation to treat every number as equally reliable.
Table of Contents
- From Ambiguity to Insight
- Defining Your Benchmarking Scope and Peer Set
- Choosing the Right Performance Metrics
- Gathering and Reconciling Disparate Data
- Analyzing and Visualizing Your Results
- Presenting Findings and Maintaining the Benchmark
From Ambiguity to Insight
A credible benchmark begins when the analyst stops asking, “Which operator has the most capacity?” and starts asking, “What exactly is being compared, and how confidently can each observation support that comparison?”
The distinction matters in infrastructure markets. A disclosed IT load may be suitable for a conservative capacity comparison. An estimated figure can still help reveal the likely shape of a market, but it shouldn't be presented as if the operator reported it. A planned project may indicate pipeline direction without proving that capacity will become operational. Combining those categories into one unqualified ranking creates a precise-looking answer with an unstable foundation.
The U.S. Bureau of Labor Statistics account of CES benchmarking describes benchmarking as a method for aligning survey-based estimates with higher-quality population values, assessing accuracy, reducing error, and preserving month-to-month movement where possible. The lesson transfers directly to data center research: a benchmark should compare a measured or estimated series with a trusted external standard, then document how the comparison was reconciled.
The real analytical product
The output isn't a table of facilities. It's a decision instrument that helps a development team assess competitive scale, helps an investor understand pipeline exposure, or helps a site-selection team distinguish operating presence from announced ambition.
That requires four disciplines:
- Define the question: Decide whether the benchmark measures current operating scale, future capacity, efficiency, environmental exposure, or competitive concentration.
- Standardize the unit: Keep IT capacity, facility status, geography, and operator identity consistent.
- Separate evidence classes: Mark disclosed, inferred, and estimated values rather than blending them without distinction.
- Explain uncertainty: Show where the conclusion is strong and where it depends on assumptions.
Practical rule: A smaller benchmark built from comparable, well-documented observations can be more useful than a larger ranking assembled from incompatible figures.
The analyst's advantage comes from making ambiguity visible without allowing it to paralyze the research. Public data rarely provides a complete view, but a structured method can still produce a defensible one.
Defining Your Benchmarking Scope and Peer Set
A benchmark without a defined boundary is only a collection of numbers. Before collecting capacity or efficiency data, the research team should write a scope statement that names the market, the facility population, the comparison period, the metrics, and the treatment of missing information.
The scope should answer three questions.
Geography determines comparability
A market can mean a metropolitan area, a power region, a planning jurisdiction, or a commercial cluster. Those definitions shouldn't be mixed. A Frankfurt benchmark, for example, might include facilities inside a chosen metropolitan boundary while excluding nearby sites that compete for customers but sit in a different power or planning environment. The correct boundary depends on the decision being supported.
A useful scope statement might read: “Facilities within the defined Frankfurt market, compared by operator, status, and IT capacity, with operational and pipeline assets reported separately.” The wording is more valuable than it looks because it prevents the dataset from expanding whenever a new project appears.
Operator type shapes the peer set
Hyperscale, colocation, wholesale, enterprise, and specialized facilities answer different competitive questions. A benchmark that combines them without classification may reward a business model rather than reveal performance. If the question concerns wholesale capacity, the peer set should exclude facilities whose operating model makes their published figures structurally different.
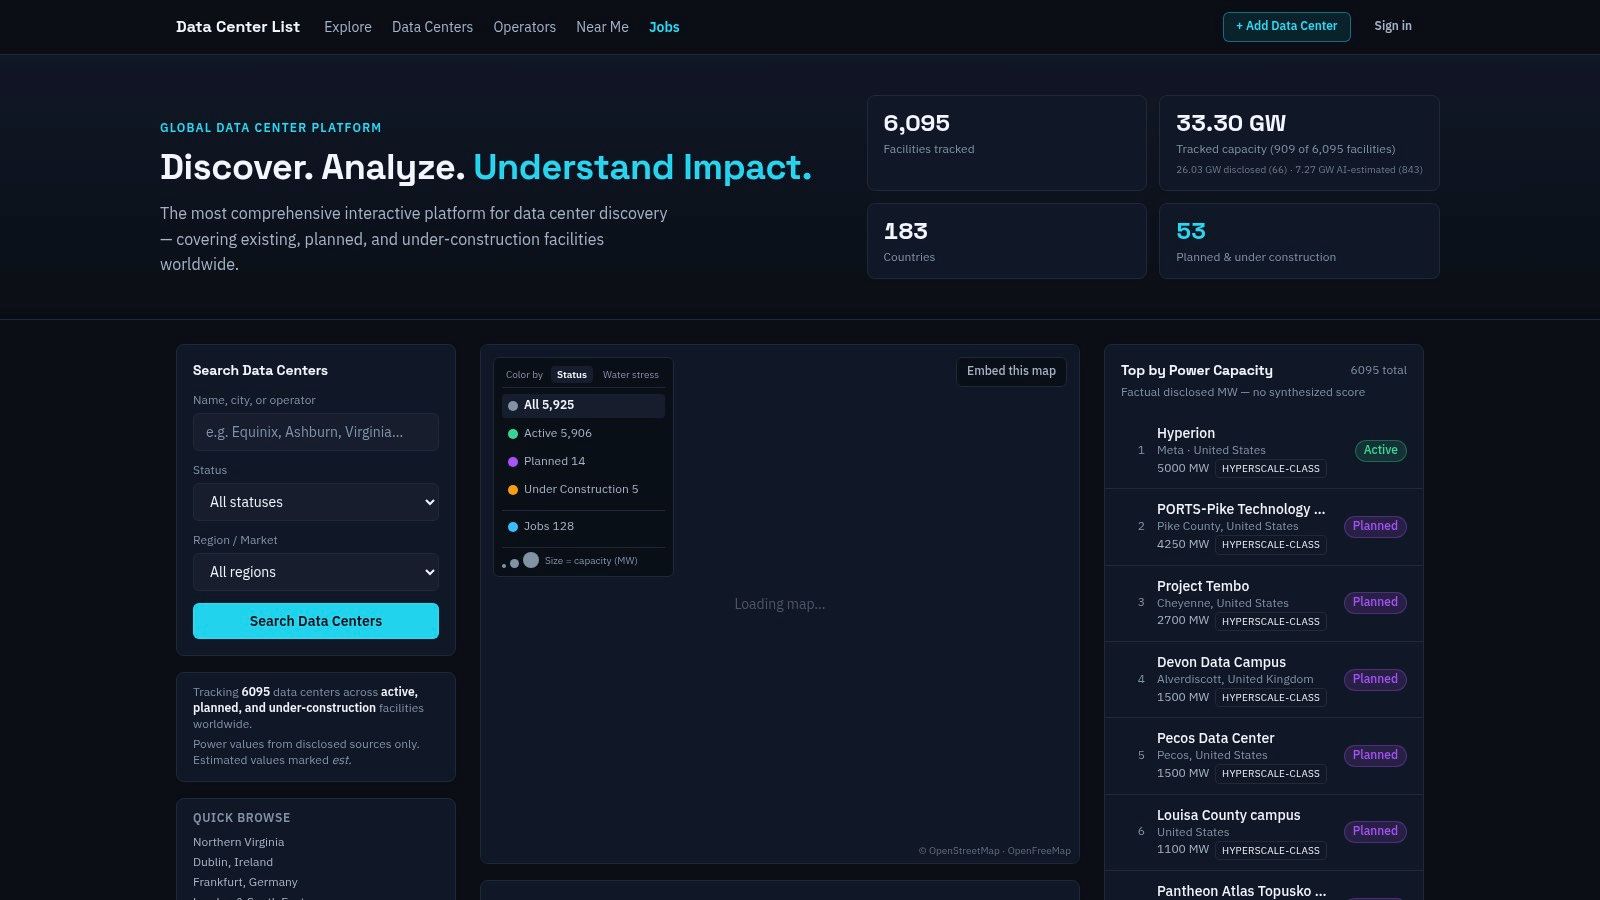
Operator identity also needs normalization. Parent companies, brands, joint ventures, and development partners can appear under different names in public records. A researcher can use an operator directory such as Data Centers List operators to organize the initial peer set, then verify ownership and operating relationships against the underlying records.
Status establishes the time horizon
“Active,” “under construction,” and “planned” are not interchangeable. Active sites describe current presence. Under-construction sites provide a more advanced view of likely additions. Planned projects indicate stated intent or a development possibility, not guaranteed delivered capacity.
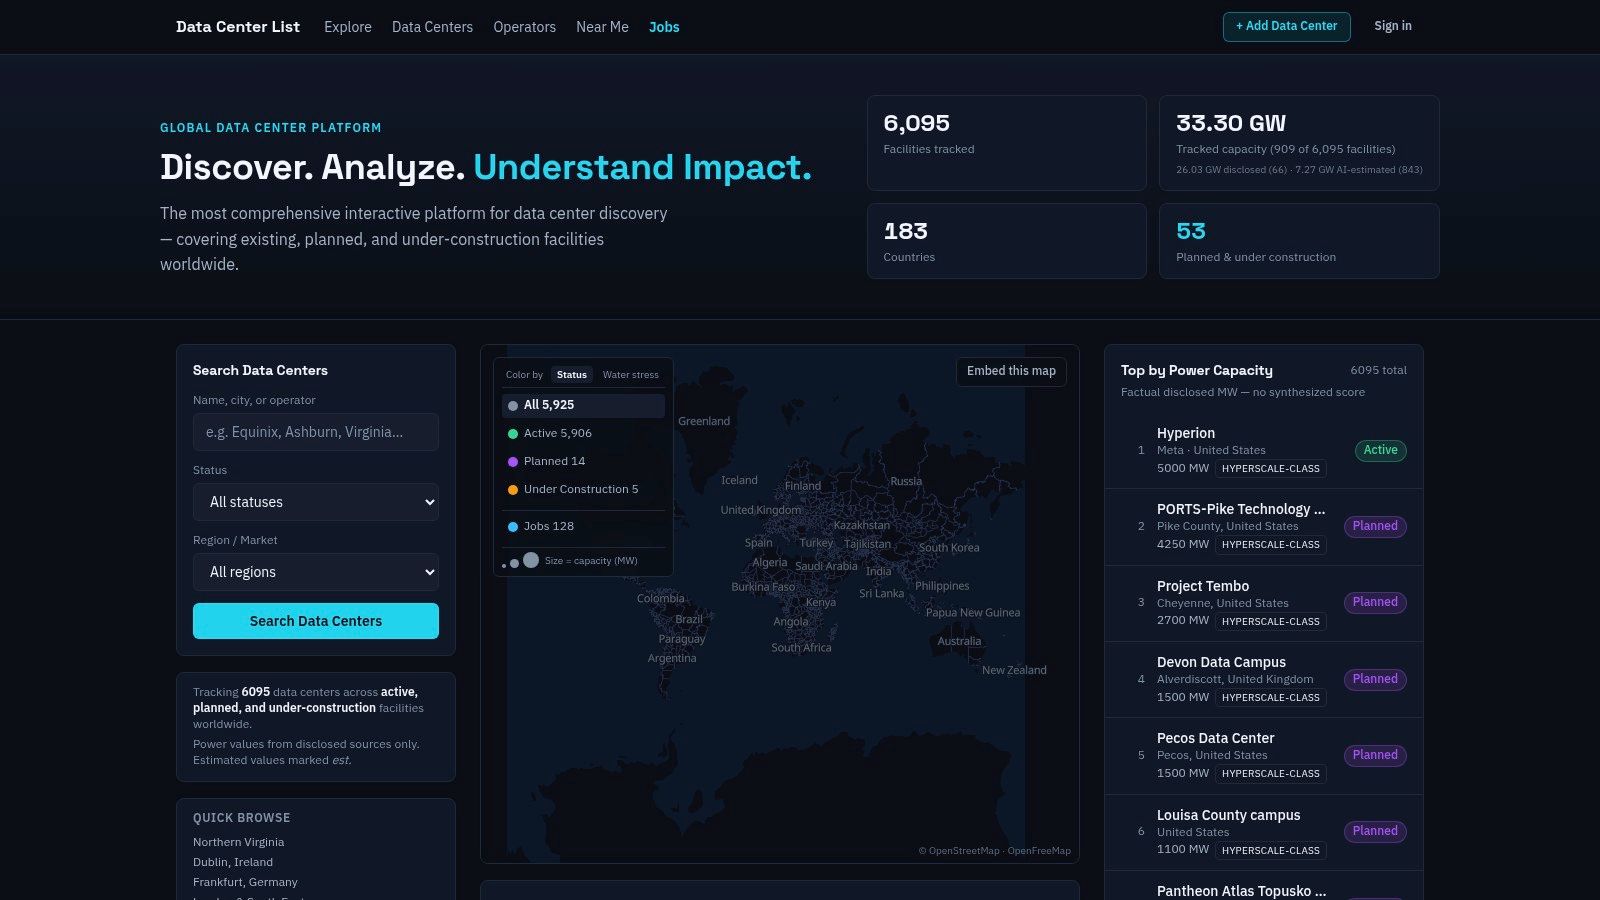
The platform's market and status filters provide a practical way to build separate populations, but the analyst should preserve those categories in the exported working file. A forecast benchmark can include planned and under-construction projects, while a current-market benchmark should not allow them to inflate operating capacity.
The research literature emphasizes that benchmarking needs a tight scope, representative datasets, and explicit inclusion and exclusion rules. A scope that's too broad consumes resources and introduces incompatible observations, while a scope that's too narrow can produce a misleading picture. The methodological guidance on representative datasets and transparent exclusions supports documenting removals rather than hiding them.
A defensible peer-set record should retain:
- Market boundary: The geographic definition and any excluded adjacent areas.
- Operator classification: The business model and treatment of joint ventures or brands.
- Project status: The status used for inclusion, with active and pipeline assets separated.
- Evidence rule: The minimum documentation required for a disclosed figure.
- Exclusion log: The facilities removed, the reason, and the effect on interpretation.
That record turns a subjective shortlist into a reproducible research design.
Choosing the Right Performance Metrics
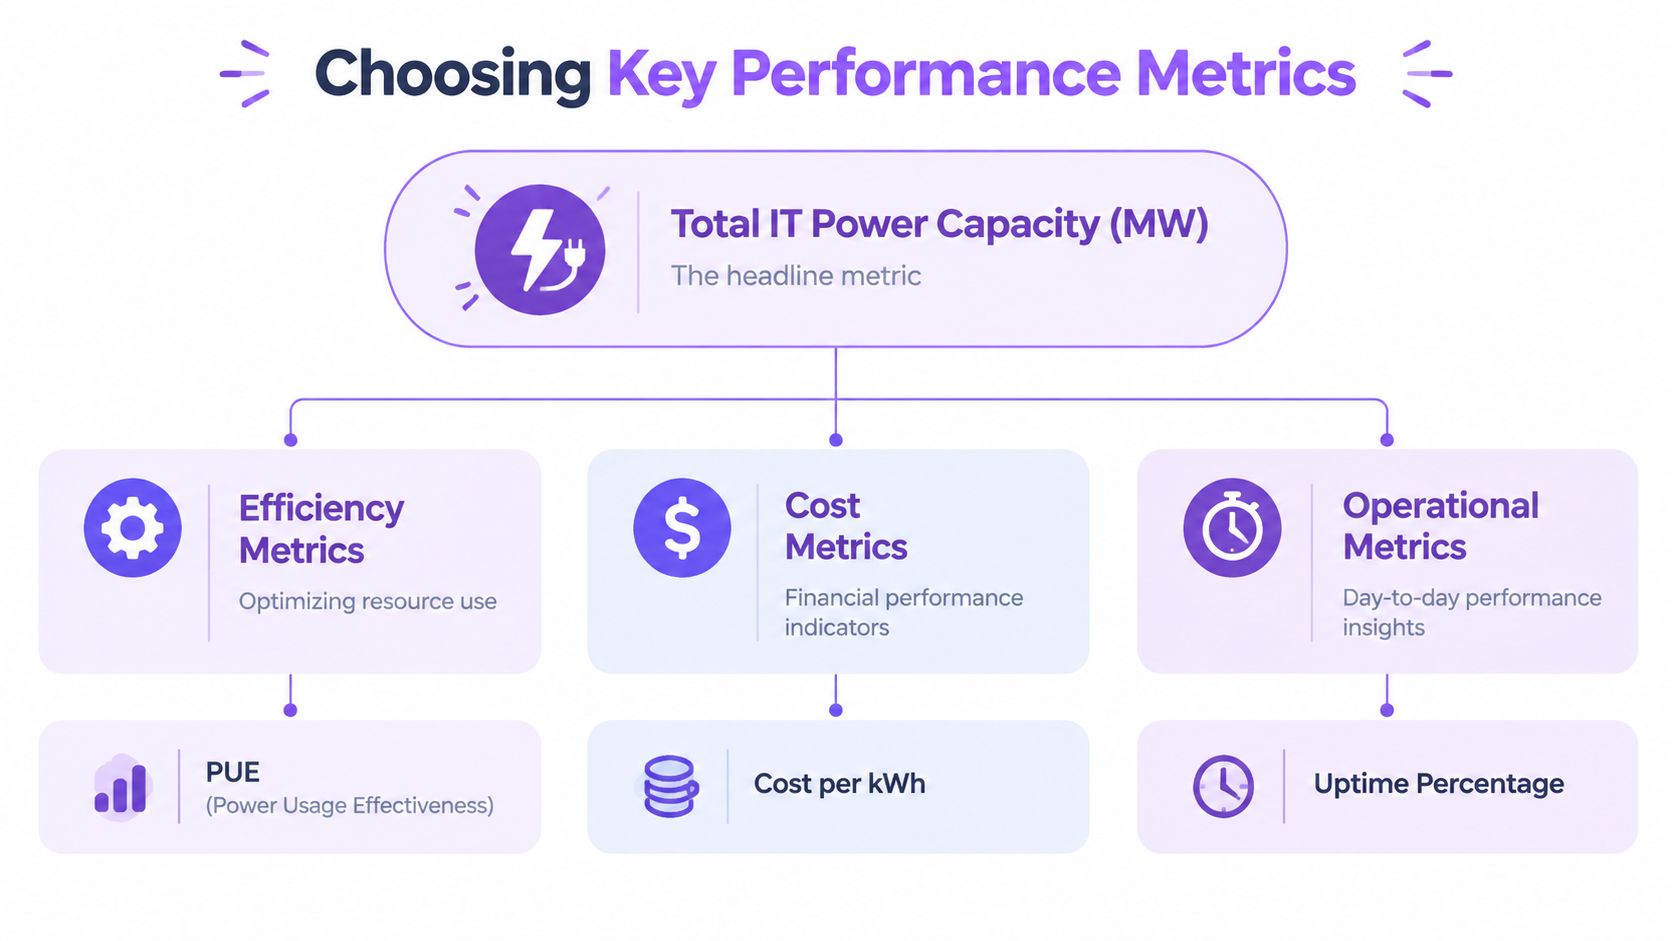
A benchmark can show two operators with similar IT capacity while missing a major difference in energy use, water exposure, or local contribution. The metric set must therefore reflect the decision being made, not only the fields most often disclosed.
A site-selection team may prioritize available power and water risk. An investor may examine operating scale, pipeline maturity, and concentration. A public-sector stakeholder may focus on resource use and employment rather than aggregate capacity. These objectives require different weights and, in some cases, different evidence standards.
The government's benchmarking framework begins by confirming objectives and metrics. The sequence matters because easy-to-collect measures can create a false sense of precision. Analysts should first define the decision, then select indicators that clarify it.
Capacity measures market scale
IT MW requires a precise definition. It may describe current installed load, contracted capacity, design capacity, utility connection capacity, or ultimate campus potential. Each supports a different conclusion. The dataset should preserve the source's original meaning where disclosed, rather than relabeling a broad campus figure as current IT load.
Capacity also needs a status field. Active IT MW indicates operating scale. Under-construction and planned IT MW indicate potential supply, but planned capacity is a pipeline signal, not an immediate competitive position. Combining these categories can make an operator appear larger than its current operating base.
Efficiency measures operational discipline
Power Usage Effectiveness, or PUE, relates total facility energy to energy delivered to IT equipment. A lower PUE generally means less supporting energy is used for each unit of IT load. Comparisons remain meaningful only when the measurement period, facility type, climate, and reporting method are sufficiently comparable.
A PUE value without a date or boundary can distort the benchmark. Record whether it describes a single site, a portfolio, a design target, or an operational observation. A design target indicates intended performance. It should not be ranked directly beside an independently measured operating result without a clear label.
Water measures resource exposure
Water Usage Effectiveness, or WUE, frames cooling-related resource use. It matters where water availability, permitting, drought conditions, or community scrutiny may limit development. The benchmark should distinguish reported consumption from modeled values and preserve the system boundary, because annual water use and water intensity answer different questions.
Geographic context changes the interpretation. A facility with limited reported consumption may still operate in an area where water stress creates a material expansion risk. WUE is therefore more useful as a resource-exposure lens than as a standalone efficiency ranking.
Jobs measures local contribution
Jobs created adds a community dimension to infrastructure benchmarking. The figure may represent construction employment, permanent operations roles, indirect employment, or a stated target. These categories should remain separate. A project announcement describing expected construction work is not evidence of permanent staffing.
The same discipline applies to cost metrics, uptime, and other operational indicators. A scorecard can include:
| Category | Core metric | Strategic question |
|---|---|---|
| Scale | IT capacity | What operating or pipeline presence does the operator have? |
| Efficiency | PUE | How effectively does the facility use supporting energy? |
| Resource risk | WUE and water context | Could water availability affect resilience or expansion? |
| Community | Jobs and employment type | What local contribution is disclosed or estimated? |
| Operations | Availability and service measures | How does the asset perform day to day? |
No single metric should decide the ranking. The scorecard should show the evidence class beside each measure, separating disclosed observations from estimates and modeled outputs. That prevents a precise-looking estimate from carrying the same weight as a directly reported operating result.
A predictive view can use structured capacity, status, and location fields, supported by the data center predictive modeling resource. Model output must remain separate from observed operating metrics, with assumptions recorded so analysts can test how sensitive the benchmark is to incomplete data.
Gathering and Reconciling Disparate Data
The assumption that every data point belongs in the same column is the fastest way to weaken a benchmark. Public records, operator disclosures, planning documents, sustainability reporting, and structured directories often describe the same facility at different levels of detail. One source may provide an exact IT load, while another indicates only a campus scale or development phase.
The analyst should treat data quality as a field in the dataset, not as an invisible judgment made during spreadsheet cleanup.
Build evidence classes before calculating
A practical classification separates at least three conditions:
- Disclosed: The operator, planning authority, filing, or other identified source explicitly reports the figure.
- Estimated: The figure is derived from an analytical method, model, or comparable facility rather than directly stated.
- Unknown: The available evidence doesn't support a responsible capacity value.
Those classes shouldn't be collapsed into a single unmarked total. A conservative benchmark can use disclosed values only. A directional market view can include estimated values, provided the result shows the split and explains the estimation basis.
The research gap around incomplete and inconsistent data is central to fair benchmarking. The review of evidence quality in AI benchmarking makes a broader methodological point that applies to infrastructure research: stronger comparisons may use fewer, higher-integrity observations and explicitly separate observed from estimated values.
Reconcile meaning before reconciling totals
A figure shouldn't enter the benchmark until its meaning is clear. The data dictionary should capture:
- Measurement type: IT load, facility load, utility capacity, design capacity, or campus potential.
- Status at observation: Active, under construction, planned, or unclear.
- Reference date: Announcement date, reporting date, planning date, or estimate date.
- Geographic unit: Facility, campus, market, or regional portfolio.
- Source confidence: Direct disclosure, corroborated public record, modeled estimate, or unresolved conflict.
This prevents a common error, where a campus-level announcement is added to a facility-level operating total. It also exposes double counting when several buildings share a campus name or when a development partner and operator describe the same project separately.
Use two views instead of one compromised answer
The conservative view answers, “What can be supported directly?” The directional view answers, “What market shape is plausible when labeled estimates are included?” Both can be useful, but they serve different decisions.
A simple reporting layout might show:
| View | Included evidence | Appropriate use |
|---|---|---|
| Conservative | Disclosed values with verified status | Investment review and defensible current-scale comparison |
| Directional | Disclosed plus labeled estimates | Market mapping and potential supply analysis |
| Unresolved | Conflicting or incomplete records | Research queue, not ranked output |
The analyst should never allow an estimate to inherit the credibility of a disclosed figure merely because both are expressed in MW. A clearly labeled estimate can improve coverage. An unlabeled estimate can distort operator rankings, market share, and pipeline conclusions.
A structured directory such as Data Centers List research computing services can serve as one public-data input for organizing facility records, but the benchmark still needs its own evidence rules, reconciliation log, and review process.
Analyzing and Visualizing Your Results
Once records are normalized, analysis should follow a calculation plan, not begin with a chart. Define whether the output measures current operations, potential future supply, or a combined market view. Mixing those categories can make a planned project appear equivalent to an operating facility, especially when capacity figures come from disclosures of different quality.
Calculate position with a declared denominator
For operator market share by IT capacity, divide each operator's included IT capacity by the total included IT capacity for the same market, status group, and evidence class. State the denominator directly below the chart. If the calculation includes disclosed active capacity only, label it accordingly. It should not be presented as total market capacity while estimated or pipeline assets remain outside the calculation.
The same rule applies to rankings. A “top operators” table should specify whether it ranks facilities, campuses, portfolios, active assets, or total pipeline. Include evidence status beside capacity so readers can separate a documented position from one partly supported by estimation.
A denominator is not a technical footnote. It determines what the comparison means.
Separate operating scale from pipeline direction
Show active, under-construction, and planned capacity in separate series. A market with substantial planned capacity may face future competitive pressure, but planning status does not establish delivery. A market with a smaller announced pipeline may offer clearer near-term visibility if more projects have reached construction.
Several directional indicators can be calculated without combining them into one score:
- Operating concentration: How much active disclosed capacity is associated with each operator?
- Construction momentum: Which operators have projects beyond the planning stage?
- Pipeline breadth: Is potential capacity concentrated in one campus or distributed across several sites?
- Evidence dependency: How much of the apparent position relies on estimated rather than disclosed values?
Analytical discipline: A rank describes order. It does not explain the commercial reason behind that order.
Explain the result by examining project status, market geography, operator type, power availability, and disclosure behavior. An operator may appear to be gaining share because it has a large disclosed pipeline, because other operators disclose less, or because several records were consolidated under one normalized name. Each explanation leads to a different commercial interpretation.
Make the visual carry the caveat
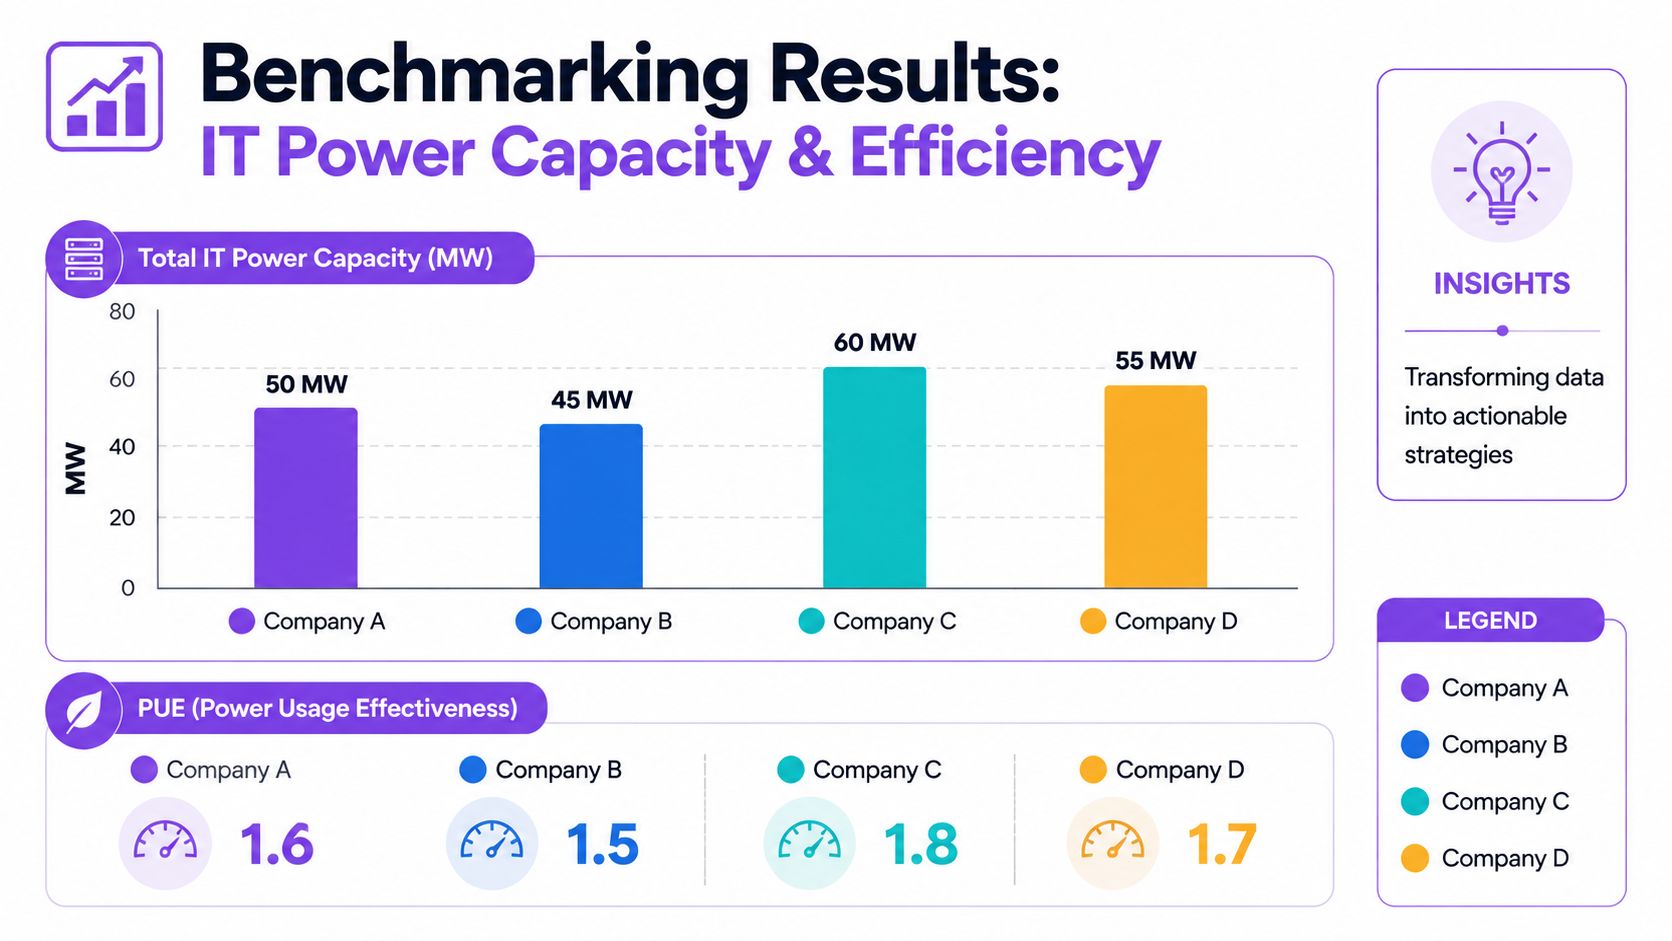
A useful chart should show more than a ranked bar. Use color or symbols for project status, a separate marker for disclosed versus estimated values, and a note identifying the denominator. A second view can display PUE or another operating metric without allowing it to disappear beneath a capacity ranking.
Put the scope in the chart title. “Active disclosed IT capacity by operator in the defined Dublin market” is more informative than “Market leaders.” Tables should include source date, status, evidence class, and unresolved-data notes. If the caveat cannot fit into the visual, simplify the comparison or move the qualification into an adjacent note.
Strong benchmark design combines multiple quantitative metrics with relevant secondary measures. This prevents one metric from determining the entire conclusion while other dimensions receive no treatment. Reproducible analysis also requires comparable methods, consistent settings, and reporting that extends beyond a single headline result, as described in the guidance on reproducible benchmarking and uneven analysis.
Presenting Findings and Maintaining the Benchmark
A benchmark earns trust through disclosure, not confidence of tone. The final report should state the scope, peer-set rules, metric definitions, observation dates, source types, treatment of missing records, and the proportion of the analysis supported by disclosed versus estimated information, without disguising one class as the other.
The executive summary should lead with the decision implication, then show the evidence boundary. For example, a finding may indicate that one operator has the largest documented active footprint, while a separate conclusion identifies another operator with the broadest planned pipeline. Those statements are more useful than a single blended ranking because they preserve the difference between current presence and future possibility.
Report uncertainty as part of the finding
Uncertainty isn't a footnote reserved for weak research. It tells stakeholders how much weight to place on the result. A report can flag unresolved capacity, inconsistent project descriptions, stale records, and estimates that materially affect the ranking. If the conclusion changes when estimates are removed, that sensitivity belongs in the main narrative.
A clear reporting pack often includes:
- Scope note: Market boundary, facility types, and project statuses.
- Metric dictionary: Definitions for IT MW, PUE, WUE, jobs, and operational measures.
- Evidence ledger: Source description, date, disclosure class, and reconciliation decision.
- Primary view: Conservative results based on the strongest comparable evidence.
- Sensitivity view: Directional results that include labeled estimates.
- Refresh triggers: Events that require review, such as a major project announcement, a planning decision, an operating update, or a new company filing.
Treat the benchmark as a living asset
Fast-moving infrastructure markets punish one-time analysis. The emerging methodology is moving toward dynamic, context-aware, reproducible benchmarking, with refresh cadence treated as a research question rather than an administrative detail. The recent review of dynamic benchmarking practices argues that benchmarks should capture change over time and account for divergence between controlled tests and real-world performance.
A refresh shouldn't merely overwrite old values. It should preserve the previous record, identify what changed, explain why the method changed, and show whether the market conclusion moved because of new evidence or revised assumptions. That history allows decision-makers to distinguish genuine competitive movement from improved data coverage.
The strongest benchmark is therefore not the one with the most rows or the sharpest ranking. It's the one that tells stakeholders what is known, what is estimated, what has changed, and what still needs verification.
Data Centers List provides a searchable directory and map for comparing facilities by market, operator, status, and IT capacity, with disclosed and AI-estimated figures labeled separately. Visit Data Centers List to build a documented peer set, review active and pipeline assets, and turn fragmented public data into a more credible competitive benchmark.