High Performance Data Center Design: Core Essentials
Learn the core essentials and design principles for a high performance data center. Build a scalable, efficient infrastructure that meets modern demands.
18 min read
The most popular advice about a high performance data center starts with the wrong question. Teams ask how many GPUs a facility can house, how many megawatts it has secured, or whether a vendor labels it “AI-ready.” Those details matter, but they don't prove that workloads will run efficiently, consistently, or sustainably.
A stronger test asks what happens at the site level. Can the facility sustain its actual rack density without thermal throttling? Can its power and cooling systems absorb a sudden workload change? Can its network deliver predictable latency? Can the site operate within local water and grid constraints? High performance isn't a single building type or certification. It's a spectrum shaped by density, cooling architecture, connectivity, resilience, and location.
That distinction matters because the market contains a wide spread of operating conditions. The 2026 Uptime Institute survey reports that the average modal rack density exceeded 11 kW for the first time, while the average excluding outliers was 7.8 kW per rack, up from 7.5 kW in 2025. The same survey found that 24% of operators reported at least some racks at 30 kW or higher (Uptime Institute Global Data Center Survey 2026).
A facility with modest rack density, stable latency, and ample thermal headroom may deliver better operational performance than a showcase site with dense hardware that constantly struggles to remove heat. The useful question isn't whether a building sounds advanced. It's whether its infrastructure matches the workloads it must carry.
Table of Contents
- Rethinking What High Performance Means
- The Core Metrics That Define Performance
- Design Principles Behind Every Modern Facility
- Cooling Architectures Compared for Dense Workloads
- Benchmarking Density Across the Fleet
- Monitoring Beyond PUE for True Efficiency
- Water Stress and Grid Fit as Selection Variables
- Selecting and Assessing Sites With Confidence
Rethinking What High Performance Means
Performance starts with the workload
A high performance data center resembles a transport network more than a warehouse. A warehouse may hold many parcels, yet still sort them slowly, route them poorly, or stop operating during a power disruption. Likewise, a facility can advertise substantial IT capacity while delivering weak results for the workloads it serves.
Megawatts deployed show available electrical capacity. Rack counts show physical occupancy. FLOPS ratings show theoretical compute capability. None reveals utilization, application locality, network congestion, thermal stability, or the capacity reserved for failures.
A team lead should ask three separate questions:
- Can the facility host the equipment? Floor loading, busway distribution, cooling delivery, and network pathways provide the answer.
- Can it run the equipment continuously? Thermal headroom, power quality, maintenance procedures, and redundancy determine that outcome.
- Can the workload meet its service objective? Latency, throughput, availability, and workload placement complete the assessment.
The distinction matters as AI systems push some racks toward 50 to 70 kW and beyond, while many existing operators remain unprepared for those loads, as described in the Uptime Institute Global Data Center Survey 2026.
Density is a spectrum, not a label
Public discussion often treats “high performance” as one category. Site conditions are more varied. A conventional enterprise room, a mixed-use colocation floor, and a dedicated AI cluster may require different combinations of air cooling, liquid cooling, power distribution, network fabric, and operational controls.
Local constraints shape that spectrum too. A dense facility in a water-stressed region faces a different design test from one with access to suitable water resources. A site connected to a constrained grid must also be judged differently from one with greater electrical flexibility. High performance depends on how those conditions interact with the workload, not on an industry-wide label.
A facility running 8 kW per rack with stable inlet temperatures and predictable response times may outperform a 40 kW showcase rack that throttles during sustained utilization. The first offers usable performance. The second concentrates hardware without enough operating headroom.
Practical rule: Treat density as a site-level distribution. The average rack reveals less than the hottest cluster, the available cooling reserve, and the facility's ability to isolate a fault.
High performance is an operating condition. It appears when electrical, thermal, networking, water, and geographic systems support the workload together. A building earns the description through repeatable outcomes, not hardware count.
The Core Metrics That Define Performance
A team lead needs a shared vocabulary before comparing facilities. Four metrics provide a useful starting point, and each answers a different question.
Latency measures the response time for a request or communication path. In the delivery analogy, latency is the time required for one package to reach its destination. It matters for interactive inference, storage access, distributed training coordination, and any application sensitive to delay.
Throughput measures how much work the system can complete over a period. It resembles the number of trucks a depot can process per hour. A site may offer excellent single-request latency but still fail under sustained volume if its network, storage, or compute pipeline cannot move enough work.
Power Usage Effectiveness, or PUE, compares total facility energy with the energy delivered to IT equipment. It resembles the overhead required to operate a depot compared with the weight of cargo moved. A lower PUE generally indicates less facility overhead, but PUE doesn't explain water sourcing, grid composition, or workload utilization.
Water Usage Effectiveness, or WUE, measures water consumption against IT energy use. It adds the water cost of cooling to the performance profile. A site with attractive PUE may still create local pressure if its cooling design depends heavily on water in a stressed watershed.
A practical metric profile
The following reference points come from common planning practice described in the brief, not from a single universal certification. They should be treated as screening targets, then tested against workload and climate conditions.
| Metric | What It Measures | High Performance Target | Primary Use |
|---|---|---|---|
| Latency | Response time across a defined path | Sub-10 ms for intra-site paths | Application placement and network design |
| Throughput | Work completed over time | Workload-specific, with sustained-load testing | Capacity planning and service assurance |
| PUE | Facility overhead relative to IT power | 1.2 to 1.4 for efficient hyperscale design | Energy efficiency and operating review |
| WUE | Water use relative to IT energy | Under 1.2 L/kWh as a serious target | Cooling and water-risk assessment |
A single metric can mislead. A facility may post a strong PUE while operating at low utilization, or meet a latency objective while lacking enough throughput during peak demand. Operators should record the measurement boundary, sampling period, workload state, and failure conditions for every metric.
The most valuable benchmark is the one that changes a decision. If inlet temperatures rise, the response might involve airflow balancing or a setpoint adjustment. If throughput falls during cluster communication, the network fabric may need redesign. If WUE rises during a dry season, workload placement or cooling mode may need to change.
Design Principles Behind Every Modern Facility
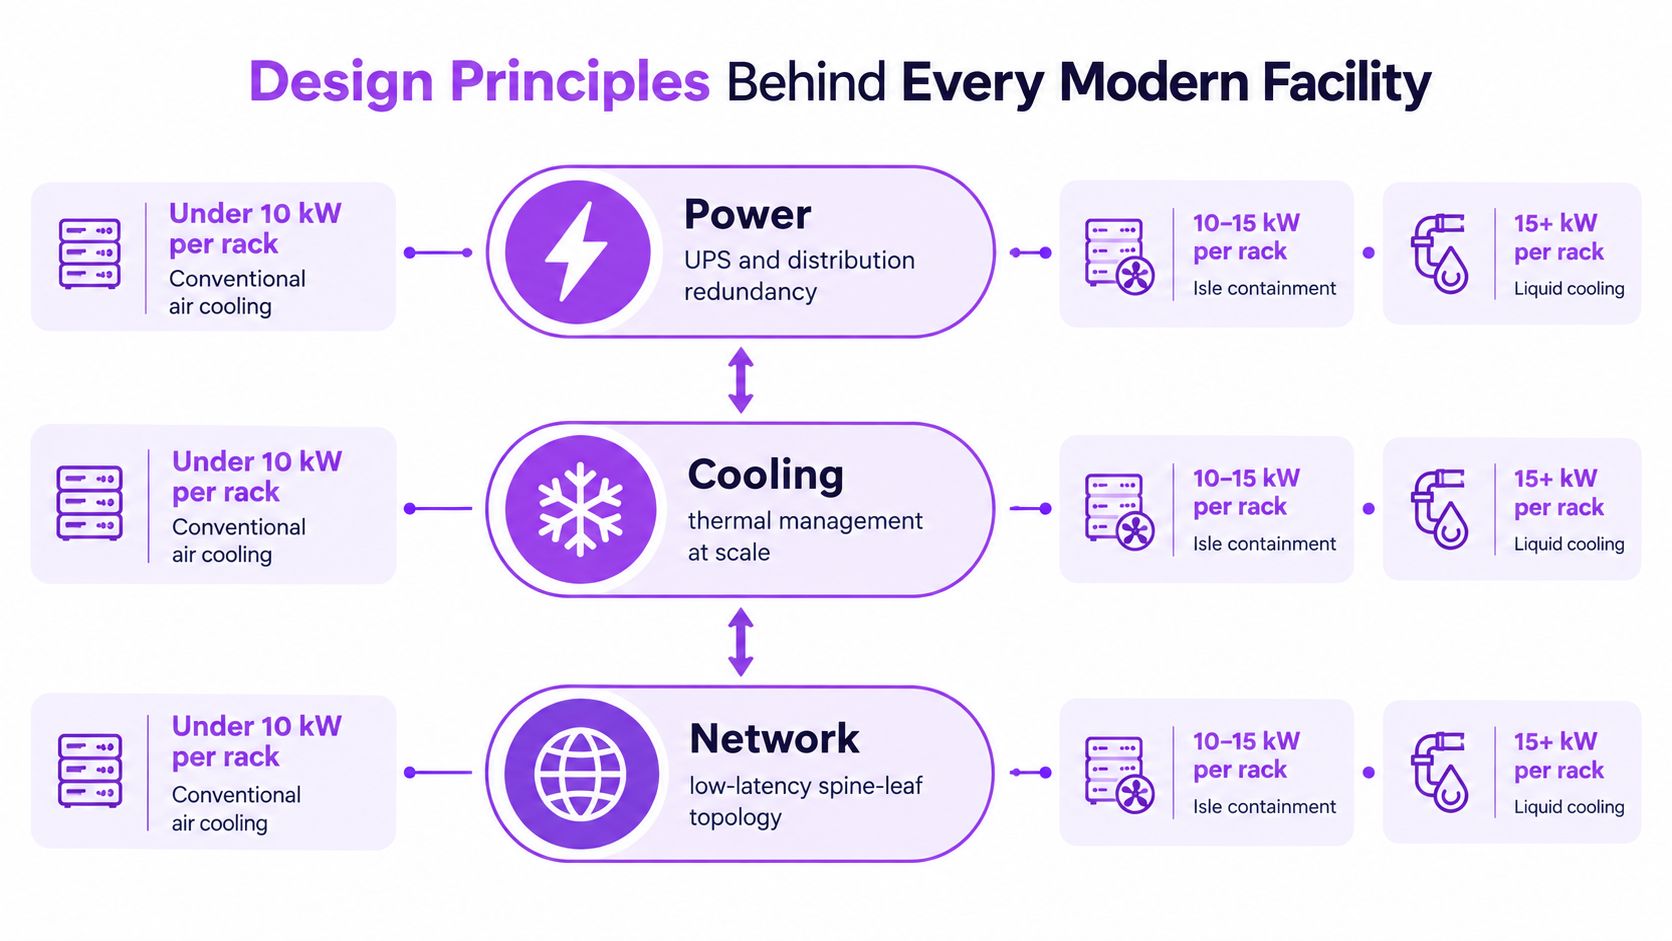
A high performance facility is not defined by one equipment choice. It is a coordinated system, where rack density, electrical capacity, cooling, networking, security, and local site conditions constrain one another. A denser rack draws more power and produces more heat. If that rack also supports tightly coupled workloads, the network must carry more east-west traffic between nearby systems.
Rack density is a useful first filter, not a universal category boundary. Public engineering guidance places the transition toward liquid cooling at roughly 15 to 20 kW per rack, because air systems may need substantial fan and HVAC effort as heat concentration increases (ASHRAE thermal guidelines). The practical decision still depends on equipment, airflow arrangement, inlet conditions, climate, water availability, and the site's power limits.
Power sets the ceiling
Electrical architecture determines whether the facility can support present and future loads. Medium-voltage feeders, transformers, UPS topology, switchgear coordination, and busway distribution control how much power reaches each row, how quickly capacity can be added, and how maintenance affects service.
A high performance facility therefore needs load growth without constant reconfiguration. Monitoring should distinguish a normal rise in utilization from an abnormal current imbalance. Cooling equipment is part of the same dependency chain. Chillers, pumps, controls, and heat-rejection systems must remain available when the IT load has the greatest operational value.
Cooling and network must scale together
Cooling defines the usable density envelope. Networking determines whether that density produces useful compute or congested communication. A spine-leaf fabric with 400 GbE capability may suit one workload, while a design prepared for 800 GbE offers more headroom for dense east-west traffic, subject to the installed hardware and application requirements.
Facility-level evidence can reveal benefits that a single efficiency ratio hides. A controlled study found that moving from 100% air cooling to a 74.9% liquid-cooling deployment reduced facility power by 18.1% and total data-center power by 10.2%, while PUE changed from 1.38 to 1.34 (Vertiv analysis of PUE and liquid cooling). The result supports examining workload density, cooling allocation, and total facility demand together rather than applying one design rule everywhere.
Security and fire protection belong in the same planning model. Teams assessing secure data centre solutions should connect access control, detection, suppression, compartmentation, and incident response with electrical and cooling dependencies. A localized incident can disable an entire thermal or power zone, even when the compute hardware itself remains functional.
Cooling Architectures Compared for Dense Workloads
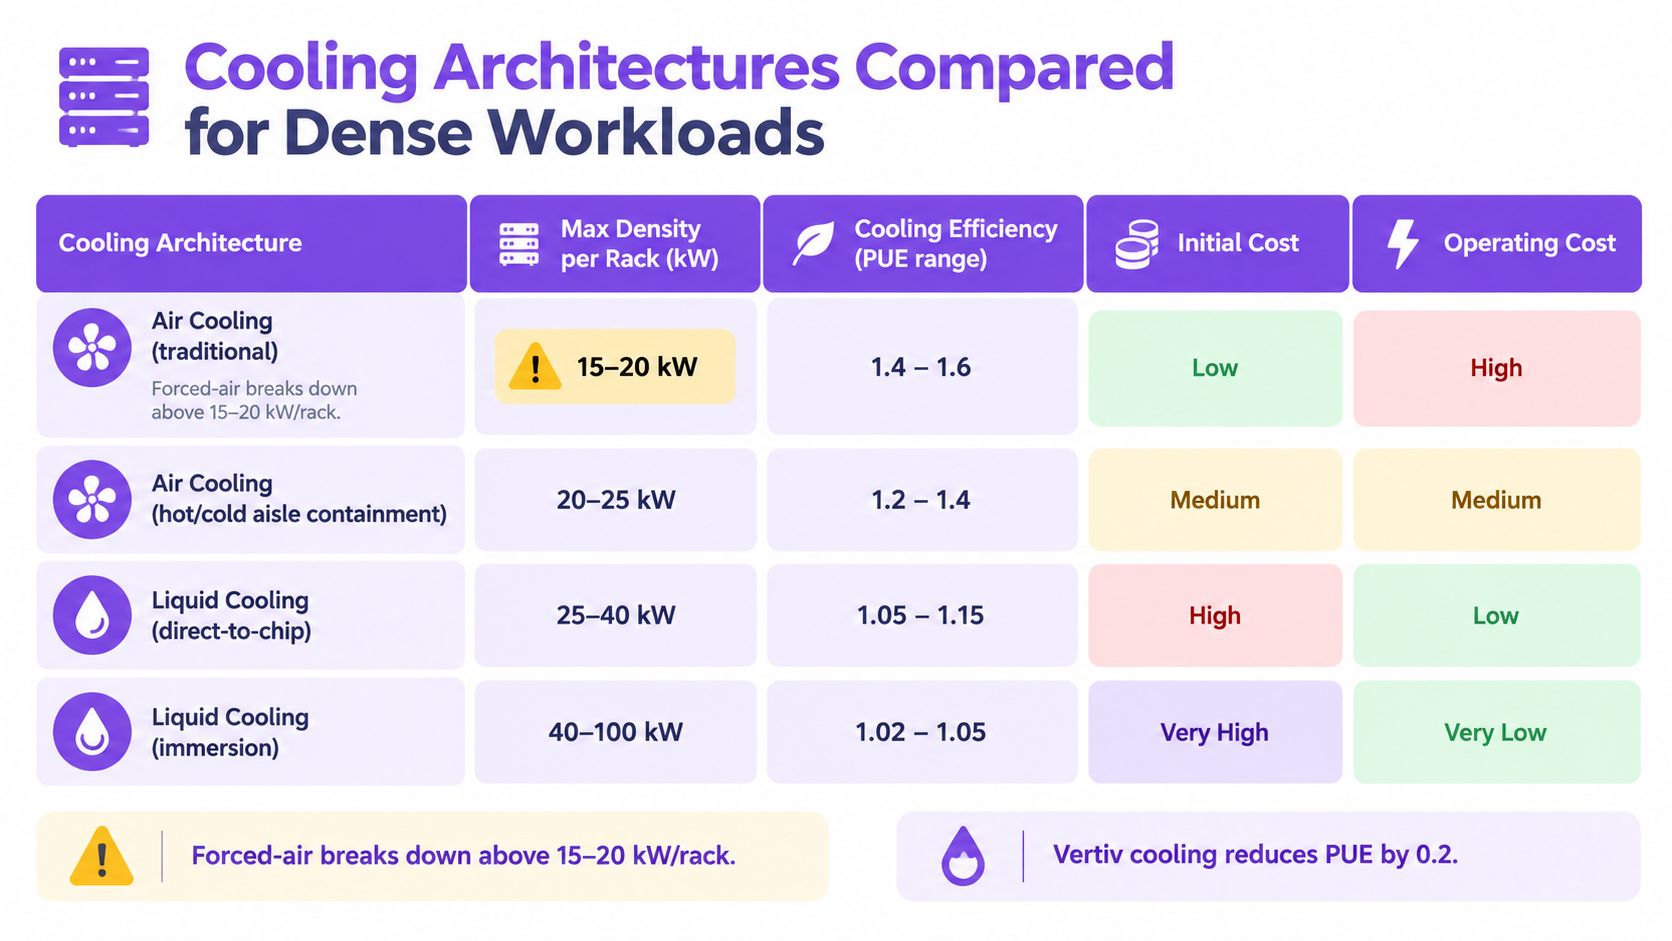
Air cooling remains sensible for many racks. It suits moderate density, predictable airflow, and contained hot and cold aisles. The constraint appears when fans and room HVAC must move too much air through too little floor area. Keeping servers within temperature limits is not the same as preserving efficiency or expansion capacity.
A useful design warning appears around 15 to 20 kW per rack. Above that range, air cooling may require substantial fan and HVAC effort to remove heat efficiently. The threshold is not a universal rule. Rack layout, supply temperature, containment, workload behavior, and local heat-rejection options can shift the practical boundary.
Air cooling favors flexibility
Contained air systems work well for mixed enterprise workloads, particularly below the density transition. Hot aisle and cold aisle containment impose order on airflow without distributing liquid to every cabinet. That can simplify maintenance, equipment replacement, and tenant operations.
The trade-off grows with density. Fans face greater pressure losses, room cooling works harder, and spare capacity disappears sooner. A site may support today's load while leaving little room for denser processors or uneven rack growth. Air cooling is therefore a practical fit for a workload band, not a default answer for every high-performance room.
Liquid cooling favors concentration
Direct-to-chip liquid cooling moves heat from processors more effectively than air, making it suitable for concentrated compute. Rear-door heat exchangers provide an intermediate arrangement, while immersion changes equipment handling, service access, and operating procedures more substantially.
The facility evidence matters more than a headline efficiency ratio. The Vertiv study examined a deployment in which 74.9% of cooling used liquid, with the remainder still air cooled. That configuration illustrates how operators can introduce liquid cooling selectively rather than convert every rack at once. It also points to part-load behavior: the value depends on which equipment is liquid cooled, how much of the facility runs at capacity, and how heat rejection responds as demand changes.
Liquid systems create obligations:
- Leak management: Detection, isolation valves, drip control, and maintenance procedures must exist before deployment.
- Retrofit feasibility: Older buildings may lack suitable floor loading, pipe routes, heat rejection, or electrical reserve.
- Mixed cooling: Storage and networking equipment may remain air cooled while compute racks use liquid.
- Lifecycle planning: Cooling distribution becomes a long-lived infrastructure decision, not a replaceable server option.
The right architecture follows the workload and the site. Moderate, varied loads may favor contained air. Sustained dense compute may require liquid capability, with local water availability, grid capacity, heat rejection, and operating profile assessed together. A high-performance facility is a spectrum shaped by those constraints, not a single cooling category.
Benchmarking Density Across the Fleet
A facility can look ordinary at portfolio level while containing a few racks that behave like a separate engineering project. Density is better understood as a set of bands, shaped by workload, cooling architecture, electrical distribution, and the building's expansion options.
As reported in the survey cited above, the average modal rack density was above 11 kW, while the average excluding outliers reached 7.8 kW per rack, compared with 7.5 kW in 2025. The survey also found that 24% of operators have at least some racks at 30 kW or higher. These figures describe reported operating conditions, not a universal design target.
Read the fleet as clusters
A portfolio is closer to a map of neighborhoods than a single street. Conventional enterprise racks, mid-density production equipment, and high-density AI clusters may share a building while requiring different power paths, cooling arrangements, and service plans.
| Density Band | Share of Fleet | Trend vs. 2023 |
|---|---|---|
| Conventional enterprise racks | Not provided in the verified data | Increasingly distinct from dense AI clusters |
| Mid-density production racks | Not provided in the verified data | Gradual upward movement |
| 30 kW and higher racks | 24% of operators report at least some racks in this band | Expanding presence in operator portfolios |
| 50 to 70 kW and higher AI-oriented racks | Not provided as a fleet share | Pressuring legacy readiness |
The verified survey data does not support a complete bell curve or a precise fleet share for every band. That gap matters. Procurement teams should not treat a headline AI rack as a typical deployment or use vendor material to fill missing site evidence.
Request records at the facility level: rack-by-rack load distribution, maximum sustained density, cooling mode by row, available electrical reserve, and the number of zones that can accept liquid infrastructure. A building suitable for conventional workloads may be a poor fit for a dense training cluster, even when both are described as high-performance environments.
For context, the Oak Ridge Leadership Computing Facility listing shows how a specialized computing site can be reviewed within a broader facility directory. Compare disclosed site attributes and operating assumptions. Do not treat one facility as a universal template.
The practical question is not whether a site belongs to one category. It is which density bands it can support, for how long, and under which local power and cooling constraints.
Monitoring Beyond PUE for True Efficiency
PUE answers one narrow question: how much total facility energy supports IT energy. It doesn't show whether the site draws water from a stressed basin, whether the grid is carbon intensive at a particular hour, or whether partial-load operation causes equipment to lose efficiency.
Two facilities can report the same PUE and still create very different environmental and operational outcomes. One may use dry cooling and a low-carbon grid, while another may rely on water-intensive heat rejection and operate during carbon-intensive periods. A useful monitoring stack must expose those differences.
Build the measurement layer
A practical system combines facility telemetry with external signals.
- Submetered power: Measure utility intake, UPS output, cooling plant demand, distribution losses, and IT load separately.
- Cooling-loop flow meters: Track coolant movement, temperature differentials, makeup water, and abnormal changes that may indicate leakage or control problems.
- Environmental probes: Monitor rack inlet temperature, humidity, pressure, and hot-aisle conditions at enough points to reveal local hotspots.
- Grid data feeds: Pull utility generation-mix and carbon-intensity data through approved data interfaces, then associate those signals with workload schedules.
- Water context: Compare WUE trends with local supply conditions, seasonal restrictions, and watershed stress indicators.
PUE belongs at the center of the dashboard, but it needs supporting measures. CUE, or Carbon Usage Effectiveness, attributes emissions to energy use. WUE tracks water consumption. ERE, or Energy Reuse Effectiveness, accounts for useful heat recovered outside the facility.
Turn telemetry into operating decisions
A mature routine is deliberately repetitive. Operators review inlet temperatures, cooling alarms, power quality, and load balance each morning. They trend WUE against local water conditions during the week. Each month, they examine carbon attribution by workload and identify whether placement or scheduling decisions increased environmental impact.
The dashboard isn't the outcome. A benchmark matters only when it changes a setpoint, airflow balance, maintenance plan, cooling mode, or workload location.
A facility profile such as the Massachusetts Green High Performance Computing Center listing can provide useful public context during market research, but operational decisions still require direct meter data and documented boundaries. Public listings support comparison. They don't replace commissioning records or live telemetry.
Water Stress and Grid Fit as Selection Variables
Power capacity often dominates site selection, but a high performance data center can fail commercially if its cooling design conflicts with local water conditions or if grid constraints make reliable operation difficult. Water and grid fit should be screened before a team finalizes an IT load.
The 2026 water-focused analysis cited in the brief projects U.S. data center water demand rising from about 17.4 billion gallons in 2023 to between 38 and 73 billion gallons by 2028. It also notes that some larger facilities can use up to 5 million gallons per day, while indirect water use from electricity generation adds another layer to the impact (Water and Data Centers 2026).
Water changes the feasibility calculation
Liquid cooling at the server can operate in a closed loop, but the building still must reject heat. Evaporative systems may reduce energy use while consuming more water. Dry cooling can reduce direct water dependence while increasing electrical demand under some conditions. The selection therefore involves a tradeoff among WUE, PUE, climate, water stress, permitting, and grid capacity.
Local water conditions can also determine whether expansion is possible. A site with adequate present supply may face restrictions during dry periods, while a cooler or wetter location may offer more operational flexibility. The question isn't whether a building has water access. It is whether the cooling architecture remains viable as density grows and local conditions change.
Grid quality is more than a connection point
A grid connection must be evaluated for reliability, curtailment exposure, expansion timing, and carbon intensity by hour. A facility with a lower PUE can still have a larger overall footprint if its electricity comes from a more carbon-intensive system. Procurement teams should therefore request both facility efficiency data and the location's power profile.
The following table is a screening lens, not a universal compliance standard. The brief provides the stated review triggers, but it doesn't establish a verified hard-reject threshold for every market.
| Signal | Acceptable Range | Trigger Deeper Review | Hard Reject Zone |
|---|---|---|---|
| WUE | Lower is preferable, with local water conditions documented | Above 1.5 L/kWh in a high-stress watershed | No universal value established |
| Grid carbon intensity | Lower hourly and annual intensity | Above 400 gCO2/kWh | No universal value established |
| Water availability | Legally secured and resilient supply | Seasonal restrictions or uncertain expansion rights | No universal value established |
| Grid capacity | Confirmed current and future service | Delayed reinforcement or curtailment risk | No universal value established |
A public facility reference, such as the Foulum Data Center listing, can support location research, but procurement teams should obtain site-specific water and grid documentation before approval. Operators should publish PUE, WUE, water source, and carbon context together so buyers can compare facilities on an equivalent basis.
Selecting and Assessing Sites With Confidence
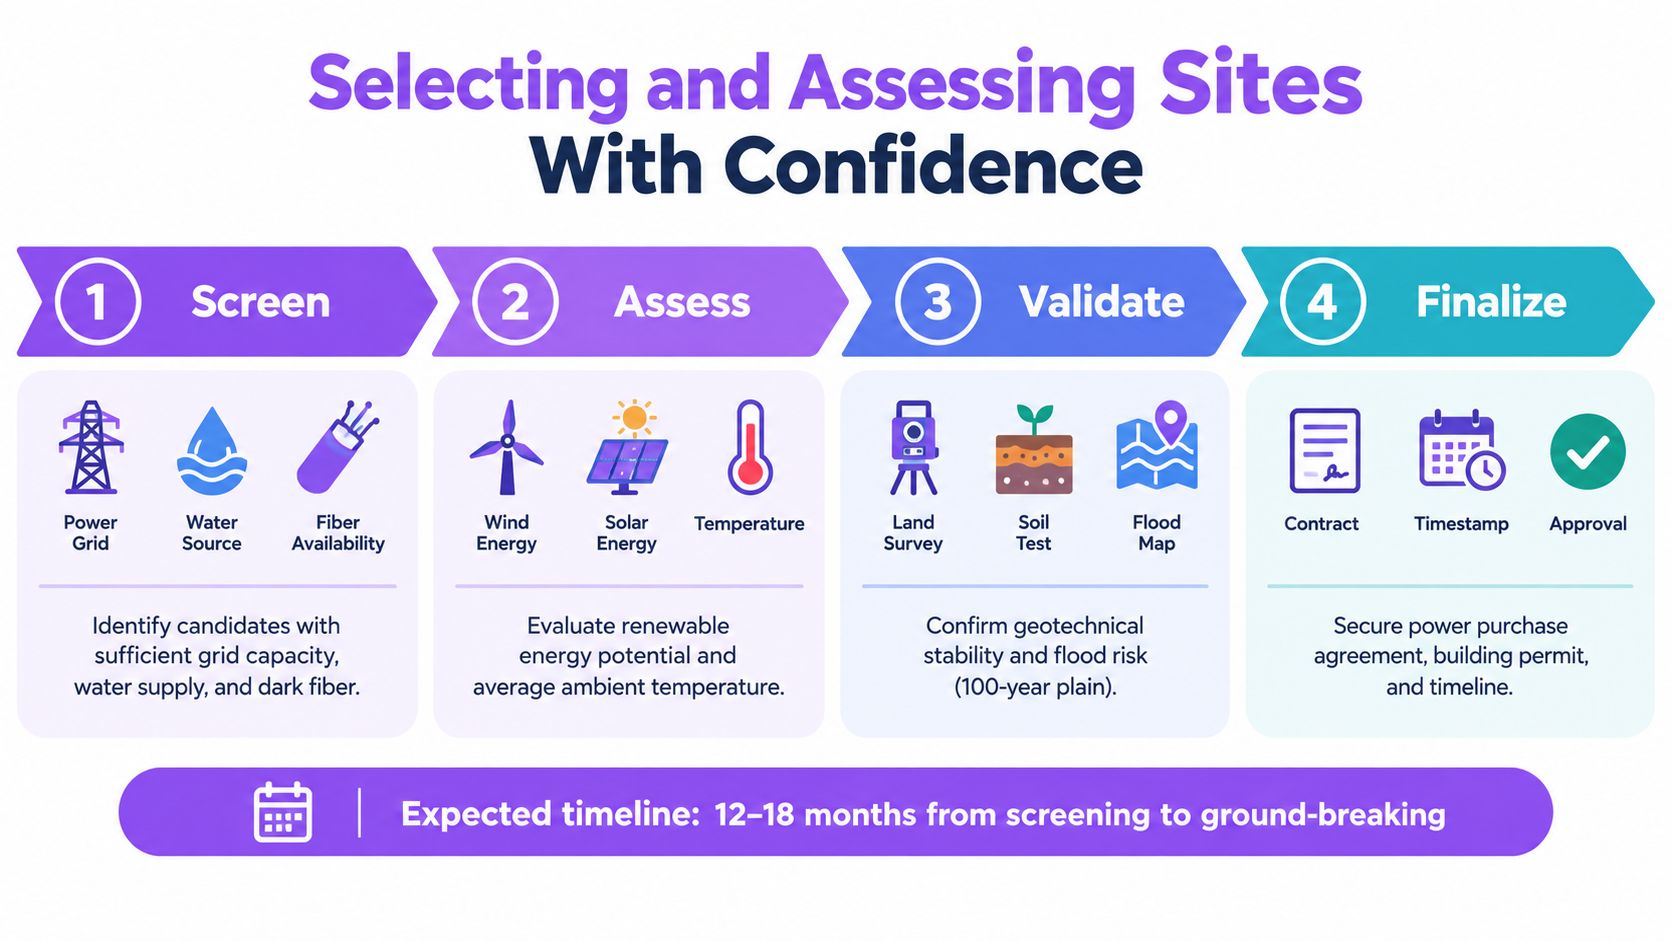
Site selection works best as a funnel. The first stage removes candidates that lack credible water or grid fit. The second tests whether the proposed rack density matches the cooling architecture. The third validates network reach and latency. The final stage tests whether the operator can manage the facility under stress rather than only during normal conditions.
Use a four-stage screening funnel
Screen the location. Confirm available grid capacity, expansion rights, water supply, climate conditions, and diverse fiber routes. A site that cannot support the required service envelope shouldn't advance because its land price looks attractive.
Assess the infrastructure. Map expected rack density to electrical distribution, floor loading, heat rejection, and liquid-cooling readiness. Request evidence for the hottest planned zone, not just the portfolio average.
Validate connectivity. Confirm latency to user populations, cloud and network ecosystems, storage locations, and dark-fiber paths. A powerful facility in the wrong place may create more network cost and application delay than it removes.
Finalize operational readiness. Walk through DCIM dashboards, maintenance procedures, incident response, spare-parts controls, commissioning records, and reference calls. The operator should show how the facility behaves during a cooling fault, power transfer, network interruption, or sudden density increase.
Give procurement a measurable checklist
The final request for information should require more than a headline capacity figure.
- Efficiency evidence: PUE and WUE bands, measurement boundaries, and seasonal assumptions.
- Density capability: Maximum sustained rack load, liquid-cooling compatibility, floor-load documentation, and expansion reserve.
- Power resilience: Feeder arrangement, UPS topology, maintenance bypass, generator strategy, and curtailment exposure.
- Connectivity: Diverse fiber entrances, redundant paths, latency measurements, and available interconnection options.
- Environmental fit: Water source, watershed context, hourly grid-carbon data, and heat-rejection method.
- Incident readiness: Escalation procedures, response roles, recovery objectives, and documented testing.
- Market context: Planned and operating facilities, competing demand, local permitting conditions, and development pipeline.
For broader market research, the Beyond Surplus guide to Atlanta data centers offers location context that can complement site-level technical diligence. A directory or market guide can identify candidates, but engineering validation must confirm the assumptions behind each candidate.
Site selection doesn't end at contract signature. Water conditions, grid composition, tenant density, and expansion plans evolve. Quarterly reviews should update the workload forecast, cooling reserve, water risk, network paths, and carbon profile so the facility remains high performance as its operating envelope changes.
Data Centers List provides a searchable global directory and interactive map for comparing facility locations, operators, status, capacity context, pipeline visibility, and water-stress signals. Teams assessing a high performance data center can use Data Centers List to build a location shortlist, compare site-level evidence, and identify planned or under-construction capacity before deeper engineering due diligence.