Global Data Center Market: Capacity, Regions, and Risks
Explore the global data center market — capacity, regional leaders, AI demand drivers, and risks shaping growth and site selection in 2026 and beyond.
17 min read
The global data center market is approaching a physical limit that headline demand figures often conceal. The International Energy Agency estimates that data centers consumed 415 TWh of electricity in 2024, about 1.5% of global electricity use, and projects consumption above 1,000 TWh by 2030 in its base case (IEA analysis of energy demand from AI). The investment question is therefore changing. Demand exists, capital is available, and announced projects are numerous, but only facilities with secured power, permits, equipment, and community acceptance can become operating capacity.
That distinction separates announced supply from shippable megawatts. A market ranking based only on planned capacity can overstate near-term availability, while a directory that distinguishes active, under-construction, and planned facilities gives investors and operators a more useful view of execution risk. The global data center market is scaling rapidly, but its next phase will be governed less by appetite for racks than by access to electricity, land, water, and approvals.
Table of Contents
- Sizing the Global Data Center Market in 2026
- What Cloud and AI Are Doing to Demand
- Regional Leaders and Where Capacity Is Heaviest
- Pipeline and Construction Economics Through 2030
- Power, Water, and the Real Risks to Growth
- Using Directory Data for Market and Site Decisions
- What Operators and Investors Should Watch Next
Sizing the Global Data Center Market in 2026
Market size depends on the layer being measured. Revenue forecasts describe the economic envelope around colocation, hyperscale development, equipment, and related infrastructure. Capacity measures describe the physical system that operators can deploy. Those measures should be read together, but they shouldn't be treated as interchangeable.
One independent forecast places the global data center market at around $389 billion in 2024, with growth to $691.6 billion by 2030 at a 10.6% CAGR. A separate outlook projects nearly 100 GW of new capacity between 2026 and 2030, effectively doubling global capacity over that span and taking total capacity to about 200 GW by 2030. That outlook also estimates roughly $1.2 trillion in real estate asset value creation over the same period.
These figures describe a large and expanding opportunity, but they don't prove that every announced megawatt will arrive on schedule. The same capacity outlook reports construction costs rising from $7.7 million per MW in 2020 to $10.7 million per MW in 2025. Higher costs can preserve development value for projects with power and permits while making speculative proposals harder to finance and deliver.
Headline scale versus deliverable capacity
| Metric | Headline value | Adjusted reality |
|---|---|---|
| Global market value | $389 billion in 2024, projected at $691.6 billion by 2030 | Revenue growth doesn't equal energized capacity |
| New capacity | Nearly 100 GW projected for 2026–2030 | Delivery depends on grid access, permits, equipment, and land |
| Global capacity by 2030 | About 200 GW projected | The total depends on projects moving beyond announcements |
| Construction economics | $7.7 million per MW in 2020, $10.7 million per MW in 2025 | Cost inflation raises the hurdle for uncommitted sites |
| Electricity demand | 415 TWh in 2024, projected above 1,000 TWh by 2030 | Power procurement becomes a core development capability |
The most useful 2026 question isn't how large the market is. It's how much capacity can be delivered inside a defined power and permitting window. Analysts should assign greater weight to energized substations, executed interconnection agreements, approved planning applications, equipment orders, and signed tenant commitments than to a project's announcement status.
Practical rule: Treat a planned megawatt as a probability-weighted option until the project has evidence of grid, permit, and construction progress.
That approach changes valuation. A smaller project with a credible energization path may be more valuable than a larger proposal in a congested market. It also changes market comparison, because the strongest region isn't necessarily the one with the largest project list. It's the region where the highest share of proposed capacity can move through the delivery chain.
What Cloud and AI Are Doing to Demand
Cloud demand and AI demand don't place identical requirements on facilities. General-purpose cloud workloads typically value geographic reach, redundancy, network connectivity, and flexible scaling. AI training favors concentrated power blocks, high-density halls, specialized cooling, and internal networking, while inference places more value on proximity to users and distributed availability.
That split creates two different forms of demand in the global data center market. Training can support large centralized campuses where land and electricity are available. Inference can support regional facilities closer to customers, regulatory boundaries, and network exchanges. A single market may therefore attract both workloads while serving them through different buildings, power contracts, and cooling systems.
Design changes carry investment consequences
AI adoption raises the importance of power density and heat removal. Facilities designed for conventional server loads may need electrical, mechanical, and floor-layout changes before they can host newer clusters. Liquid cooling can expand the usable density of a hall, but it also introduces design, maintenance, water-management, and retrofit considerations that don't apply in the same way to a lower-density facility.
The workload split also changes location logic. Training operators can accept greater distance from end users when uninterrupted power and efficient compute matter most. Inference operators may need a broader network of sites because latency, data handling, and service continuity matter more. Secondary markets can therefore gain relevance without replacing established hubs. Their advantage may come from available power or land rather than from existing facility volume.
Demand quality matters more than demand volume
A signed requirement for a high-density AI hall is not equivalent to a generic cloud expansion plan. The former may require a specific substation configuration, cooling architecture, and delivery date. The latter may be phased across several sites and adjusted as utilization changes.
This makes tenant and workload classification essential for pipeline analysis. Analysts should record whether a project targets training, inference, enterprise workloads, or mixed demand, then test whether the proposed site can support the relevant technical profile. A project can be commercially attractive and still be physically unsuitable for the workload it hopes to serve.
The broader implication is that AI doesn't create one uniform demand wave. It fragments the market into centralized, power-dense capacity and distributed, latency-sensitive capacity. Developers that match the building type to the workload can preserve flexibility, while those that count all AI-related announcements as interchangeable capacity risk overstating the addressable supply.
Regional Leaders and Where Capacity Is Heaviest
The United States remains the largest national market by facility count, with about 5,427 data centers, compared with 529 in Germany, 523 in the United Kingdom, 449 in China, and 337 in Canada in one recent industry estimate. Facility count, however, doesn't reveal the power profile of each site or the depth of its future pipeline. A region with many smaller facilities can rank highly by count while contributing less hyperscale capacity than a region with fewer, larger campuses.
Electricity consumption shows a different concentration pattern. The United States accounted for 45% of global data center electricity consumption in 2024, followed by China at 25% and Europe at 15% (IEA executive summary). That distribution matters because power constraints are local. A national market can look large while individual metros face very different interconnection, cooling, land, and permitting conditions.
The hubs behind the national rankings
Northern Virginia, Phoenix, the Pearl River Delta, Frankfurt, Dublin, and the Nordic cluster illustrate why metro-level analysis is more useful than country-level rankings alone. Established hubs benefit from connectivity, customers, suppliers, and operating expertise. They also face congestion, competition for land, scrutiny over resource use, and longer development pathways.
The United States has the deepest concentration of hyperscale activity, while China has a substantial facility base with a different mix of site sizes and policy conditions. Western Europe combines strong enterprise and cloud demand with tighter land, power, and planning constraints. Nordic markets can offer attractive renewable power conditions and cooler climates, while Gulf markets can offer land and development ambition but require careful analysis of cooling, water, and power resilience.
| Region | Operational capacity share | Pipeline share 2026–2028 | Notable clusters |
|---|---|---|---|
| United States | Not stated in verified data | Not stated in verified data | Northern Virginia, Phoenix |
| China | Not stated in verified data | Not stated in verified data | Pearl River Delta |
| Western Europe | Not stated in verified data | Not stated in verified data | Frankfurt, Dublin |
| Nordics | Not stated in verified data | Not stated in verified data | Nordic cluster |
| Gulf | Not stated in verified data | Not stated in verified data | Emerging regional markets |
The table's missing percentages are deliberate. Available verified data supports facility counts and electricity-consumption shares, but not a defensible regional split of operational and pipeline megawatts for the stated period. Analysts shouldn't fill that gap with implied precision.
Pipeline depth is the strategic variable
A directory-level view can reveal whether a hub's future consists mainly of active facilities, construction sites, or early plans. A profile such as a facility record in Ashburn is more useful when read alongside neighboring sites, their statuses, stated capacities, and local infrastructure context.
The strongest regional signal is not the number of announcements. It's the proportion of projects with credible paths to energization. That distinction can change the investment ranking between a saturated Tier 1 market and a secondary market with fewer active assets but more available power and clearer permitting.
Pipeline and Construction Economics Through 2030
Pipeline analysis should separate three categories that are often blended in market reports: active facilities, under-construction projects, and planned projects. Active assets generate operating evidence. Projects under construction show a stronger commitment of capital and resources. Planned projects may represent genuine strategic options, but they carry the greatest risk of delay, redesign, or cancellation.
The projected addition of nearly 100 GW between 2026 and 2030 demonstrates the scale of ambition in the global data center market. It doesn't, by itself, establish how much capacity is already permitted, how much has a firm interconnection path, or how much has equipment reserved. Pipeline quality must therefore be measured by status progression rather than by aggregate announcements.
Construction costs have changed the project hurdle
Construction costs rose from $7.7 million per MW in 2020 to $10.7 million per MW in 2025, according to the cited market outlook. That increase reflects a more demanding development environment, including inflation, equipment shortages, and more complex designs. It also means that a project with uncertain power access carries more than schedule risk. It carries a larger amount of capital at risk before revenue begins.
| Region | Active | Under construction | Planned | Average build cost | Average lead time |
|---|---|---|---|---|---|
| United States | Not stated in verified data | Not stated in verified data | Not stated in verified data | $10.7 million per MW in 2025, global reference | Not stated in verified data |
| China | Not stated in verified data | Not stated in verified data | Not stated in verified data | Not stated in verified data | Not stated in verified data |
| Western Europe | Not stated in verified data | Not stated in verified data | Not stated in verified data | Not stated in verified data | Not stated in verified data |
| Nordics | Not stated in verified data | Not stated in verified data | Not stated in verified data | Not stated in verified data | Not stated in verified data |
| Gulf | Not stated in verified data | Not stated in verified data | Not stated in verified data | Not stated in verified data | Not stated in verified data |
A comparable regional table cannot be populated responsibly from the verified evidence provided. The correct analytical response is to preserve the distinction between known global cost history and unavailable regional averages.
Delivery status determines economic quality
Hyperscale direct-build projects can optimize the campus around a known workload, power profile, and long-term occupancy plan. Build-to-suit colocation projects can spread development across customer requirements and potentially serve multiple tenants, but they must manage specification changes, leasing risk, and commissioning complexity.
Prefabricated electrical and mechanical systems can reduce on-site work where designs are standardized. Liquid-cooled halls can support higher-density workloads when the supporting infrastructure is designed correctly. Neither approach removes the need for permits, utility commitments, or equipment availability. Schedule compression in one part of the build doesn't solve a delay in another.
Higher revenue potential from AI-oriented leases can support development economics, but it also raises the specification bar. A developer can't assume that a conventional shell will capture AI demand without proving that power delivery, cooling, networking, and commissioning can meet the tenant's requirements. The economic advantage therefore belongs to projects with both commercial commitment and technical readiness, not merely to projects with the largest proposed capacity.
Power, Water, and the Real Risks to Growth
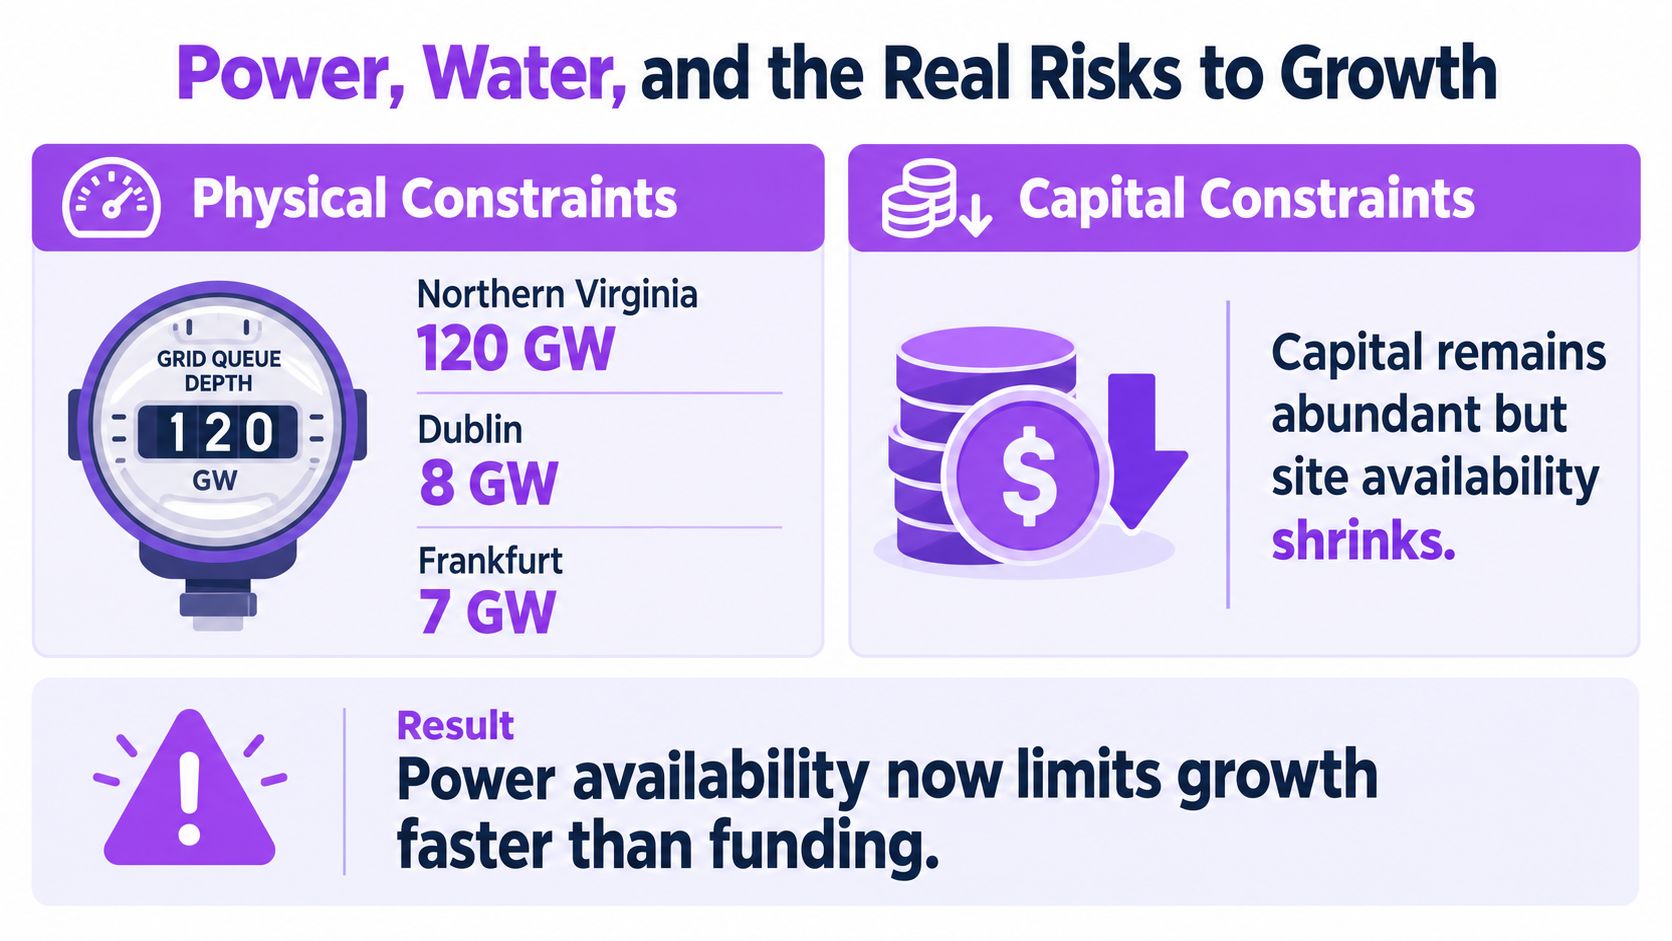
Capital is no longer the only scarce input. In many important markets, power availability, interconnection, permitting, and local resources determine whether capital can be converted into operating capacity.
The IEA's electricity estimate provides the system-level context. Data centers consumed 415 TWh in 2024, and the agency expects base-case demand to exceed 1,000 TWh by 2030, with renewables supplying the fastest-growing share of incremental load (IEA analysis of energy demand from AI). At the regional level, the United States accounted for 45% of global data center electricity consumption, China 25%, and Europe 15% in 2024 (IEA executive summary). Concentration makes local grid conditions more important than global averages suggest.
Investors identify the same constraint
In the 2025 investor survey cited in the verified data, 39% of investors named regulations and power availability as the biggest challenge, while 10% cited debt availability (CBRE investor intentions survey). The gap supports a clear conclusion. Financing may be available for credible projects, but financing can't create substation capacity or accelerate every planning approval.
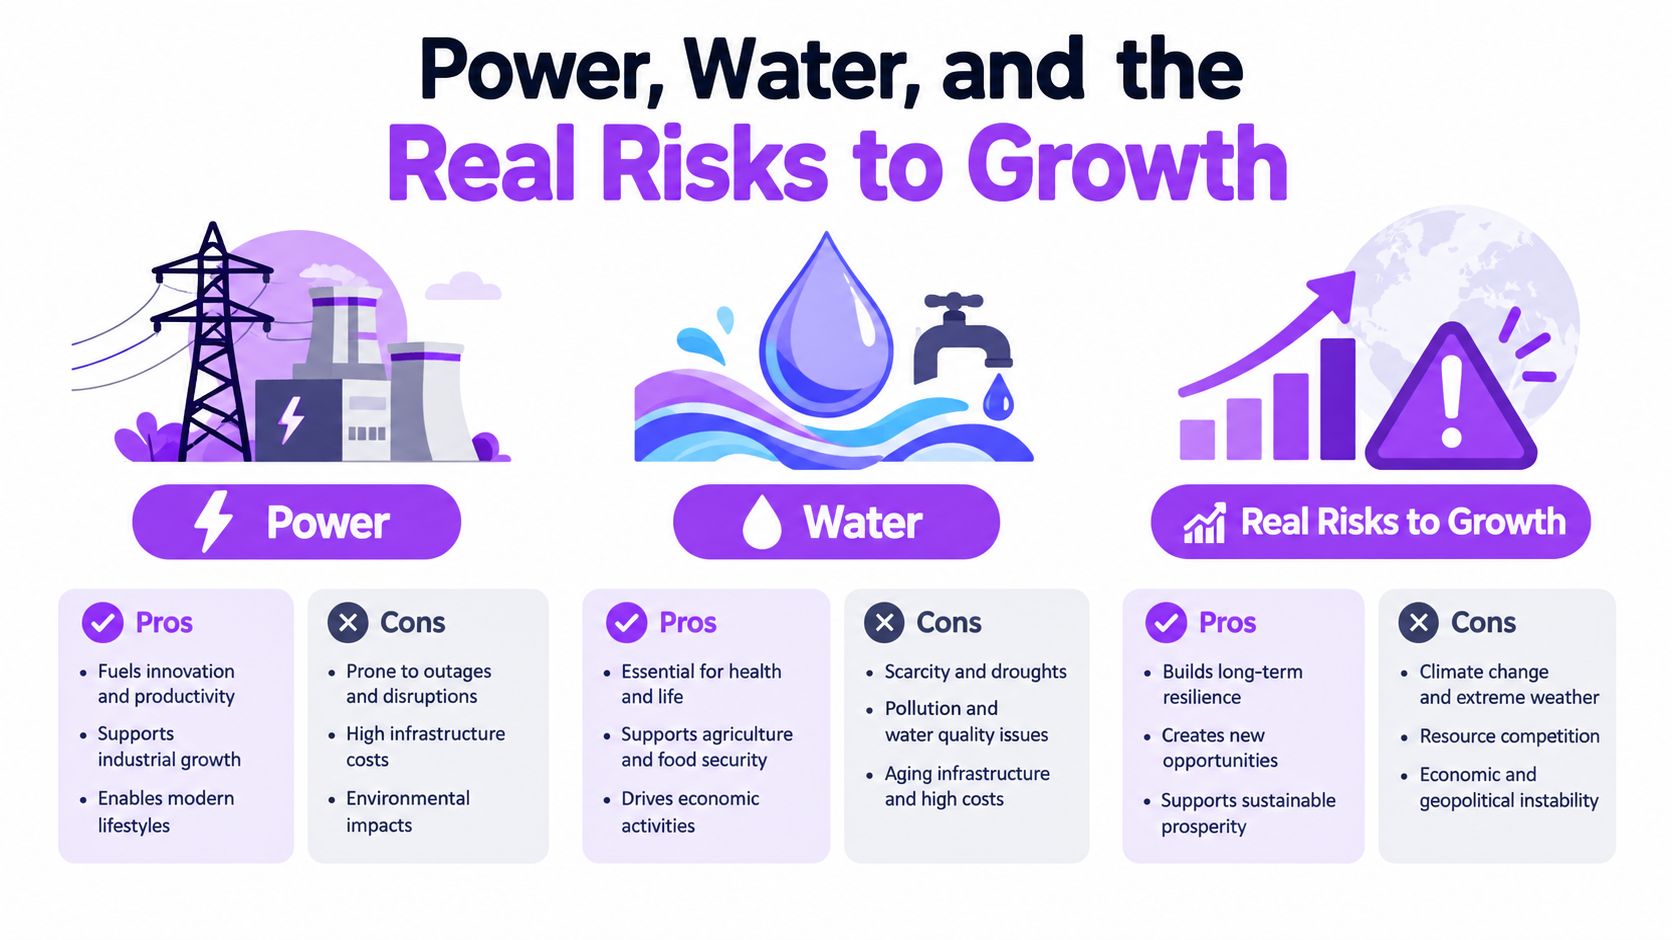
Water adds a second local constraint. Deloitte estimates that AI data centers' freshwater demand could reach as much as 1.7 trillion gallons by 2027 at the high end, and notes that a hyperscale site using air-based cooling with evaporated drinking water can require over 50 million gallons annually (Deloitte analysis of AI data center sustainability). The global share may appear manageable, but a project can still compete directly with municipal or agricultural demand in a stressed basin.
Underwriting must include local externalities
Site selectors should examine not only annual water demand but also seasonal use, source reliability, treatment requirements, discharge rules, and competing claims. A practical primer on how water rights are allocated can help frame the legal and economic questions before a project enters detailed diligence.
The risk taxonomy should include:
- Grid risk: The utility may lack near-term hosting capacity, even where land is available.
- Permit risk: Planning conditions, environmental reviews, and community objections can alter the schedule.
- Water risk: Cooling demand may conflict with municipal, agricultural, or ecological priorities.
- Supply-chain risk: Transformers, generators, switchgear, and cooling equipment can become critical-path items.
- Community risk: Noise, construction traffic, land use, and resource consumption can affect social license.
A facility profile such as the Meta Odense data center record becomes more informative when its operating status and local context are evaluated alongside utility and planning evidence. The central point is that physical constraints don't only add cost. They determine which projects can exist at all.
Using Directory Data for Market and Site Decisions
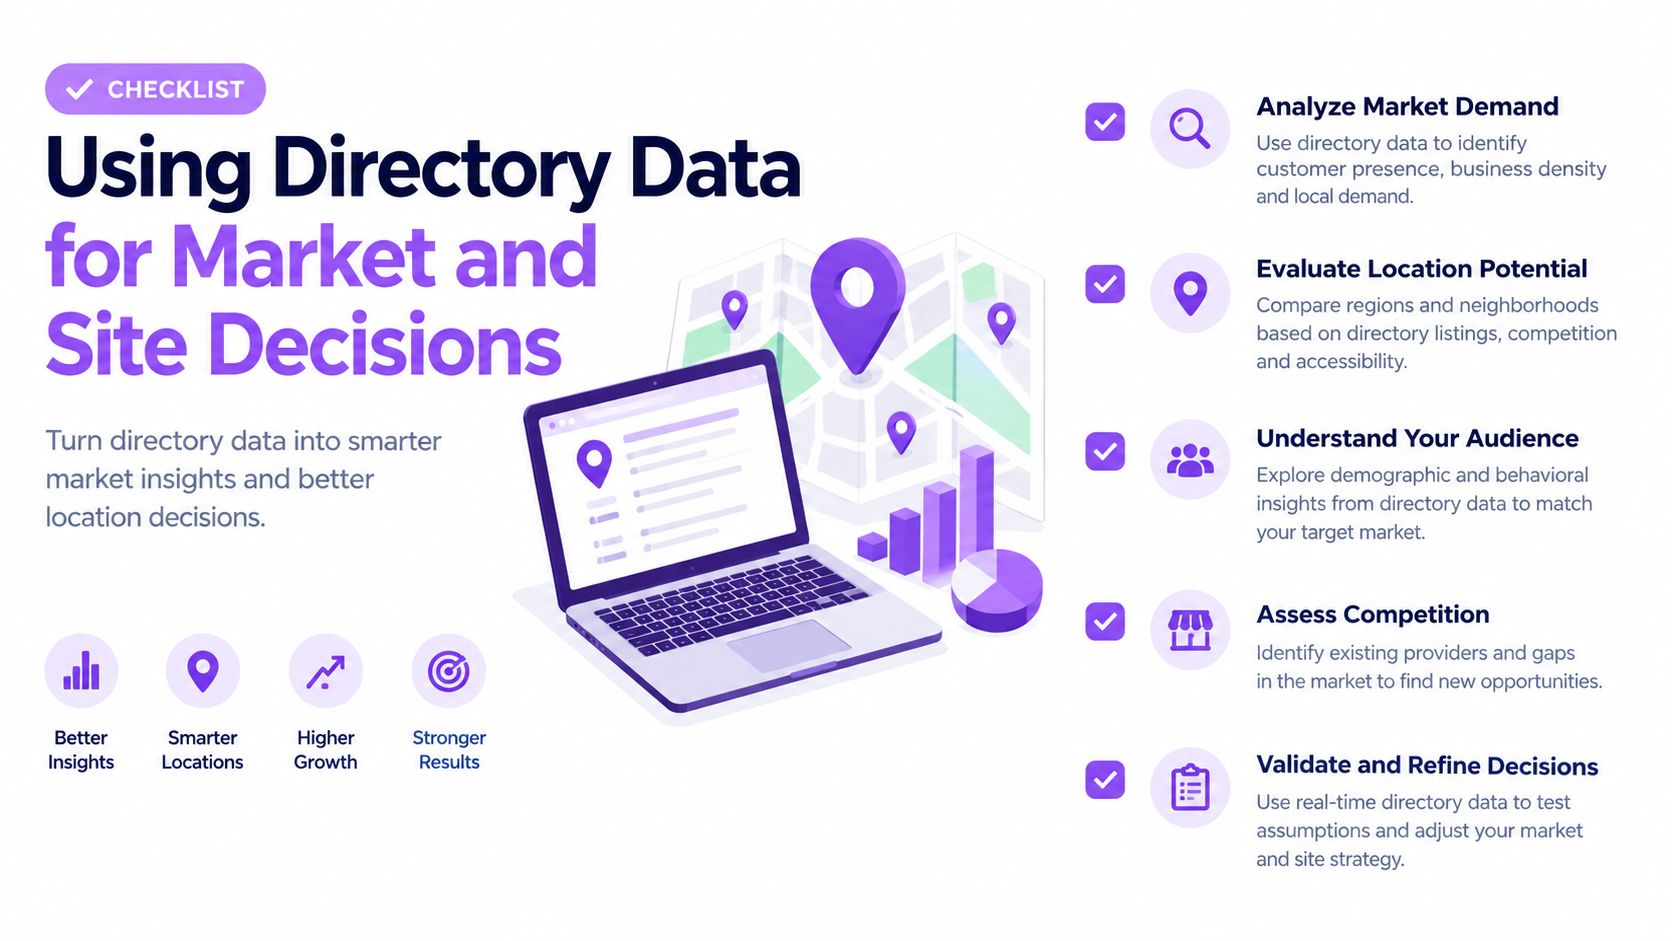
Directory data becomes valuable when analysts treat it as an evidence layer rather than a finished market conclusion. A facility list can show where assets are located, who operates them, what status they carry, and what capacity has been disclosed or estimated. It can't replace utility records, planning documents, or engineering diligence, but it can organize the search and expose gaps that a national market total hides.
The first workflow is sub-market sizing. Analysts can aggregate active facility capacity by metro, compare operator concentration, and then add under-construction and planned records as separate layers. The resulting view distinguishes the current operating base from future supply and makes it possible to ask whether a market's apparent growth depends on a few large proposals or a broad set of deliverable projects.
Three workflows for defensible analysis
Size the market by status. Separate active, under-construction, and planned facilities before calculating totals. A planned record should never be blended into operational capacity without a clear label, because doing so turns a development option into an implied operating asset.
Read the pipeline as a sequence. Tag each project by tenant or intended workload, disclosed or estimated IT power, construction status, and evidence of interconnection. The objective isn't to create a more attractive chart. It's to identify which rows have moved from commercial intention toward physical delivery.
Pressure-test candidate sites. For each location, record the nearest relevant substation, stated power pathway, water source, water-stress context, zoning history, permit status, and evidence of local restrictions. A site with a large parcel and no credible power route should rank below a smaller site with a documented path to energization.
Verification turns rows into investment evidence
Directory records need cross-checking. Utility interconnection queues can confirm whether a proposed load has entered the grid process. Municipal planning portals can show whether a project has received approvals or remains at an early consultation stage. Operator disclosures can clarify whether a capacity figure is committed, expandable, or estimated.
A structured directory such as the Data Centers List global facility directory can support this workflow by separating facility status, location, operator, and power fields. The platform includes active, planned, and under-construction records, with disclosed and AI-estimated capacity labeled separately. That distinction lets analysts build a repeatable evidence trail instead of relying on a single headline number.
A defensible market view should retain the following fields:
- Facility identity and location, including metro and country.
- Operating status, with the date and evidence behind the classification.
- IT power, separated into disclosed and estimated values.
- Pipeline stage, including construction and planning evidence.
- Grid and water dependencies, recorded as open diligence items.
- Confidence level, so uncertain records don't receive the same weight as operating assets.
The output should be a probability-weighted supply map, not a raw inventory count.
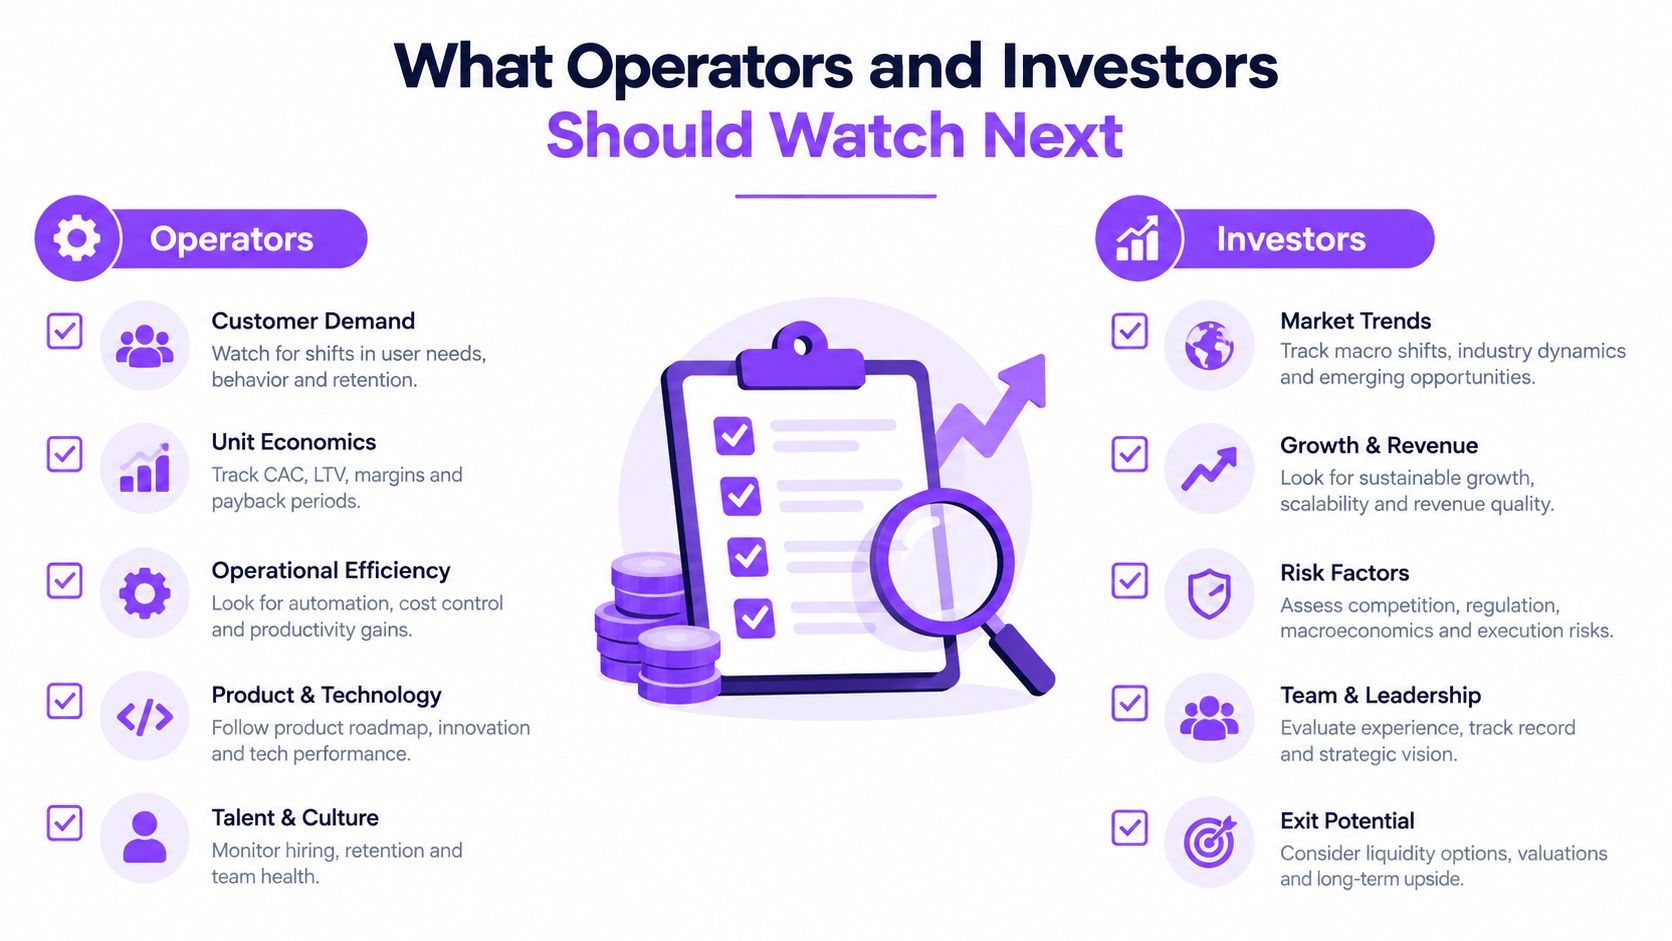
What Operators and Investors Should Watch Next
The next planning cycle should track the conversion of demand into physical delivery. The global data center market can continue expanding while individual regions disappoint if announced capacity fails to clear grid, permit, water, or equipment hurdles. Investors and operators need indicators that measure conversion, not just ambition.
A practical watchlist
- Delivered versus announced megawatts: Compare energized capacity with the full pipeline by metro and status. A widening gap signals that headline supply is outrunning execution.
- Interconnection queue depth: Monitor queue position, study milestones, executed agreements, and substation energization dates. A project without a credible grid milestone should carry a heavier schedule discount.
- Cooling-water performance: Track water reuse, source reliability, seasonal demand, and basin stress. Deloitte's high-end projection of 1.7 trillion gallons of freshwater demand by 2027 shows why water belongs in capacity planning, not only in sustainability reporting (Deloitte analysis of AI data center sustainability).
- Hyperscale pre-lease exposure: Separate projects backed by firm customer commitments from speculative capacity. Pre-leasing can support construction, but it doesn't remove technical or permitting risk.
- Construction cost versus stabilized yield: Revisit assumptions as build costs rise. The historical increase from $7.7 million per MW in 2020 to $10.7 million per MW in 2025 demonstrates how quickly the capital base can change.
- Workload mix: Identify whether new demand comes from centralized training, distributed inference, conventional cloud, or enterprise workloads. Each category creates a different site and cooling requirement.
- Regulatory movement: Watch changes to permitting timelines, water rules, environmental review, and local development conditions. A regulatory change can alter deliverability faster than a demand forecast.
Signals through the next development window
New substation energization dates offer a stronger near-term signal than a revised project announcement. AI accelerator refresh cycles can change density and cooling specifications, while secondary-market investment activity can reveal where capital is willing to follow proven delivery paths. Operators should also monitor whether new projects migrate toward secondary markets with available power, rather than assuming established hubs will absorb every increment of demand.
The central thesis is straightforward. Capital is abundant relative to the physical inputs required to build, but power, permitting, water, and pipeline quality determine who can ship capacity at scale. A regional market with fewer announced gigawatts may outperform a larger market if its projects have clearer interconnection rights, stronger community support, and a shorter path to energization.
Data Centers List offers an interactive global directory and map covering active, planned, and under-construction facilities, with operator, location, status, and disclosed or AI-estimated IT power fields for market comparison. Operators, investors, and site-selection teams can use those records to test pipeline quality against local power and resource constraints, so visit Data Centers List to evaluate the markets behind the headlines.