Data Centers Size: Power, Footprint, and Scale Classes
Understand how data centers size is measured by IT power, footprint, and rack count. Compare edge, enterprise, colocation, and hyperscale facilities.
13 min read
The usual advice on data center size starts in the wrong place. Square footage still matters, but it no longer tells a site-selection team what really constrains a project, because the binding limits now sit in grid-accessible megawatts, land area for permitting, and the split between small edge nodes and massive hyperscale campuses.
That shift shows up in the market itself. The average facility is often described at about 100,000 square feet, while hyperscale campuses can reach 10 million square feet. Independent industry summaries also put the world at roughly 11,400 to 11,800 data centers, with the United States hosting nearly 40% of them, which explains why the largest concentration of large-scale facilities remains in North America. The industry size baseline is not just a catalog of buildings, it is a map of how power and land are being absorbed.
For developers, investors, and planners, size now needs to be read through three lenses, power, footprint, and rack density. A facility can look modest on paper and still behave like a giant if its electrical envelope is large enough. The rest of this brief treats that as the central question.
Table of Contents
- Why Square Footage No Longer Defines Data Center Size
- The Three Metrics That Actually Measure Scale
- Comparing the Four Data Center Size Classes
- How Power Demand Is Reshaping Facility Scale
- Using a Directory to Benchmark and Compare Facilities
- The Hidden Scale of Land Footprint and Community Impact
- The Bifurcation of Small Edge Nodes and Giant Campuses
Why Square Footage No Longer Defines Data Center Size
Square footage is a weak proxy for data center size once power density rises. Two buildings with the same shell can support very different amounts of IT load, because the actual constraint is the electrical and thermal envelope inside that shell, not the concrete footprint alone.
That is why analysts now read a spec sheet in layers. IT power capacity, physical footprint, and rack count do different jobs, and none of them is redundant. A small but dense hall can outclass a larger but lightly loaded one, especially when cabinet power climbs and cooling systems must scale with it.
Practical rule: if a facility description gives only square footage, the site-selection team still doesn't know the operating class.
The market's language reflects that shift. Hyperscale guidance describes sites as needing at least 5,000 servers and often occupying millions of square feet, with energy draw commonly cited at over 100 MW. By contrast, edge infrastructure is often capped at 250 kW, which means a building can be physically present and still belong to a totally different scale class. Hyperscale sizing guidance and edge infrastructure limits make the point clearly, size is not one number.
The best way to think about the topic is to separate what a site looks like, what it can power, and how many cabinets it can support. That framework avoids the most common mistake in market analysis, treating a large roof as proof of large capacity. It also helps teams compare projects that would otherwise look similar on a brochure but perform very differently in the field.
The Three Metrics That Actually Measure Scale
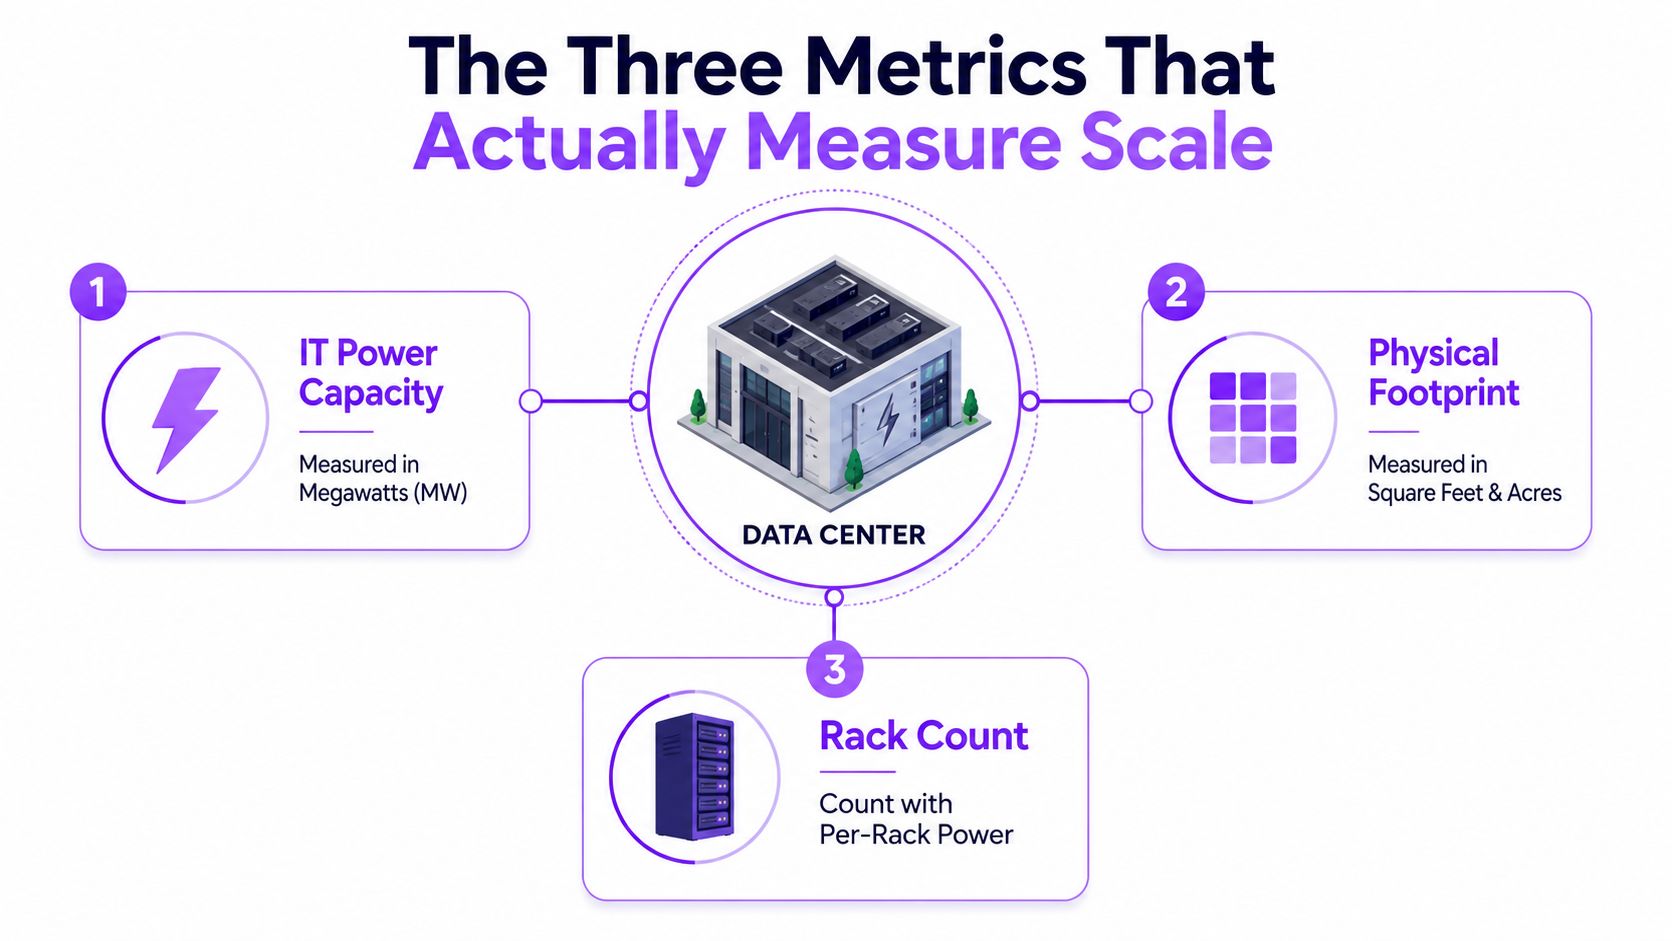
IT power capacity tells you the operating class
Megawatts are the cleanest way to compare facilities because they tie directly to utility demand, cooling plant sizing, and interconnection strategy. A facility with 50 MW of IT load and a PUE of 1.2 needs 60 MW of total facility load, while typical hyperscale PUE sits around 1.1 to 1.2 and conventional well-run sites often fall around 1.3 to 1.5. That makes power the most decision-relevant metric for siting, even before the building is designed. Hyperscale PUE and sizing guidance
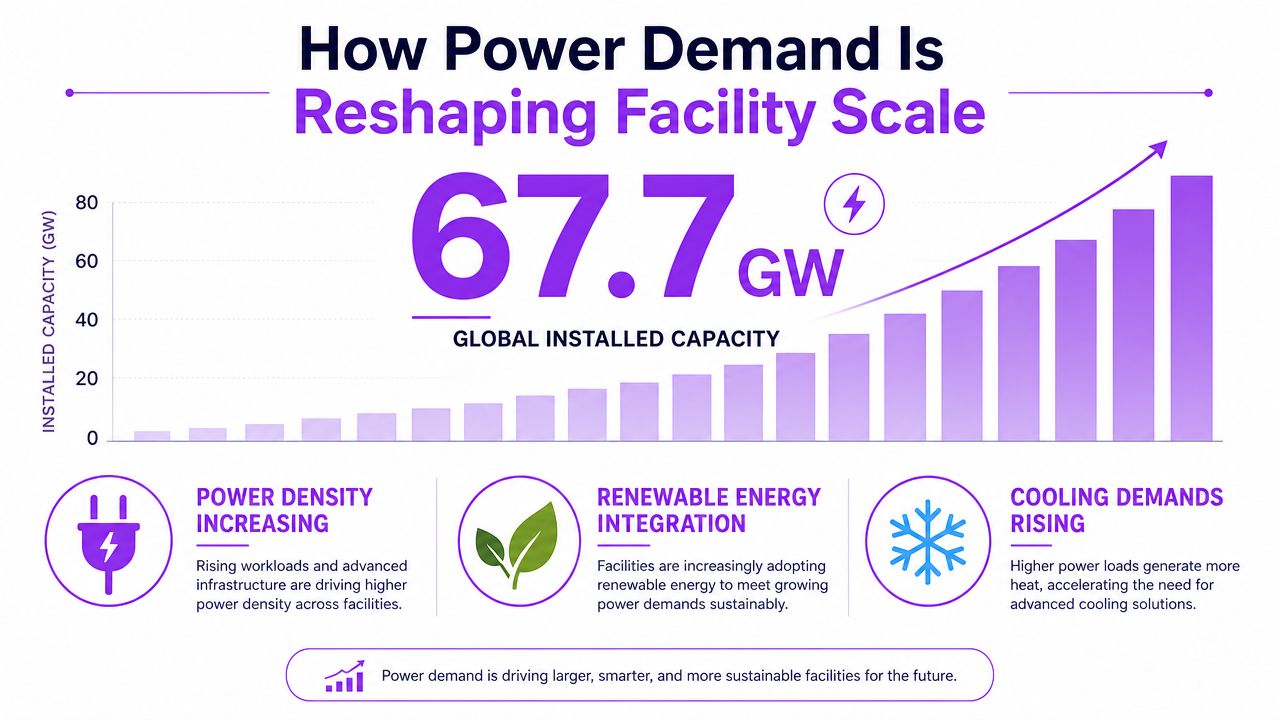
Power also explains why the industry has become harder to benchmark with simple building metrics. Global installed data center capacity is estimated at about 67.7 GW, with one industry report saying that is 36% growth in just two years. A separate global estimate says data centers used around 415 TWh of electricity in 2024, equal to roughly 47 GW of average continuous demand, and that usage has been growing at about 12% per year over the last five years. Installed capacity and demand growth
Footprint matters, but building area is only half the story
Square feet still matter for construction cost, fit-out planning, and comparing shells. But the more revealing footprint metric for community review is often acreage, because campuses consume land for substations, setbacks, water systems, and security buffers. Recent industry summaries put the average U.S. data center site at about 224 acres, and hyperscale campuses can exceed 1,000 acres. Land footprint and community impact
That acreage lens changes how a site-selection team reads a parcel. A facility that sounds modest in building terms can still dominate a zoning case if it pulls on a much larger land assembly. For that reason, footprint should be read as both building area and site area, not one or the other.
Rack count is the buyer-facing metric
Rack count matters most for colocation and enterprise buyers because it defines usable IT space. The ITU edge benchmark says a single edge site is generally capped at 250 kW, with cabinet loading often at least 5 kW per server cabinet, implying no more than about 50 cabinets before a site moves out of the edge profile. That is the kind of practical limit that square footage misses entirely. Edge data center infrastructure benchmark
A clean way to read any spec sheet is to ask three questions in order, how many MW, how many acres or square feet, and how many racks at what density.
Comparing the Four Data Center Size Classes
The market is easiest to understand when it is split into edge, enterprise, colocation, and hyperscale. Those labels are imperfect, but they capture the planning differences that matter for power delivery, zoning, and operating model.
| Data Center Size Classes at a Glance | IT Power Range | Typical Footprint | Rack Count | Primary Use Case |
|---|---|---|---|---|
| Edge | Up to 250 kW, and often within the 500 kW to 2 MW range used in industry reporting | Small footprint, often local or distributed | Limited, density-driven | Low-latency workloads and local service delivery |
| Enterprise | Commonly around 2 MW to 10 MW in practice | Building-scale site, usually controlled by one owner | Moderate, depends on internal demand | Private control, internal IT and business workloads |
| Colocation | Roughly 5 MW to 50 MW | Multi-tenant building or campus | Variable, driven by tenant mix | Shared infrastructure and flexible tenant capacity |
| Hyperscale | Over 100 MW | Millions of square feet, often campus-style | 5,000 servers and above | Cloud, platform scale, and AI infrastructure |
Edge sites are small by design. They exist close to demand, so low latency outranks brute-force scale. The ITU benchmark on 250 kW edge ceilings is a useful guardrail because it reminds teams that once cabinet density rises, cooling and electrical distribution stop behaving like a simple building problem. Edge sizing benchmark
Enterprise facilities sit in the middle. They usually balance control, resilience, and capital discipline, which makes them attractive when a company wants its own infrastructure without building hyperscale complexity. They are often easier to manage than a campus, but they still demand meaningful utility planning, especially where redundancy and uptime targets are strict.
Colocation changes the equation again because multi-tenancy turns the building into a shared capacity pool. The buyer is rarely asking for an entire campus, only for a usable allocation of power, racks, and cross-connect options. That makes rack density and contract structure as important as raw building size.
Hyperscale is a different class altogether. Guidance says those sites can exceed 100 MW, require at least 5,000 servers, and often occupy millions of square feet. For site selection, that means the comparison is not “which building is bigger”, it is “which market can carry the megawatts and the land assembly”. Hyperscale facility guidance
How Power Demand Is Reshaping Facility Scale
Power now sets the ceiling on growth faster than building trades do. Early data centers were often described at around 2 MW, while modern builds can require around 40 MW each, and large hyperscale facilities have doubled in capacity over the past five years. That is a structural change, not a temporary spike. Historical capacity shift
The bottleneck has moved upstream
A site can be shovel-ready and still be blocked if the utility cannot deliver enough capacity on the right timeline. The practical issue is no longer just whether a parcel is available, but whether the grid can support substation size, generator planning, and interconnection sequencing. In major markets, that is why grid-accessible megawatts now rank above raw acreage in the earliest screening stage.
The installed-capacity figures show how fast the market has already pushed into this constraint. Global installed capacity at 67.7 GW and average demand near 47 GW in 2024 mean scale discussions are no longer theoretical. They are a planning problem tied to load growth, transmission access, and cooling design. Installed capacity and electricity use
Why the land story keeps getting louder
Power growth also changes land math. More load means larger electrical yards, more space for cooling plants, and more room for physical separation and security. That is one reason acreage has become a more visible public issue than it used to be, especially in markets where rural parcels are being assembled into campus-style developments.
A useful internal reference point is the Middenmeer campus listing, because it illustrates how a single project can be read through location, power, and site context together rather than by floor area alone. That is the direction the whole market is moving, especially where AI loads are pushing developers toward larger, grid-heavy builds.
Planning insight: once the target load crosses into campus territory, utility coordination becomes part of the site itself.
Using a Directory to Benchmark and Compare Facilities
A directory is useful only if its fields are standardized. For benchmarking data center size, the most important fields are IT power in MW, operational status, operator identity, and location. Without those four fields, comparisons quickly slide into guesswork.
A good workflow starts with status. Sorting active, planned, and under-construction sites together lets analysts see not just current scale, but the pipeline that is likely to matter next. That matters because market concentration is not only about what is live today, it is also about what is already moving through permitting and buildout.
The next filter is power. A directory that distinguishes disclosed MW from AI-estimated MW gives a cleaner view of confidence levels, which is critical in a market where some operators publish more than others. Standardized fields also make it possible to compare one market against another without rebuilding the dataset every time.
The publisher's own facility directory is one example of a structured way to do that, since it combines status labels, operator identity, and capacity fields in a crawlable table. Used carefully, that kind of layout helps a team rank markets, compare operators, and isolate pipeline projects without mixing active assets with proposed ones.
Useful habit: benchmark power first, then check status, then read the local context. Reversing that order usually leads to confusion.
The Hidden Scale of Land Footprint and Community Impact
Land footprint is the part of data center size that communities see first. The average U.S. site covered about 224 acres in 2024, up 144% from 2022, and hyperscale campuses can exceed 1,000 acres. That scale reaches far beyond the building line, because it affects zoning, road access, stormwater, and whether a project can be fitted into existing industrial land.
Why acreage changes the conversation
Acreage is not just a real estate detail. It often determines whether a project feels like an infill use or a large-scale conversion, especially when farmland or open land is assembled into a campus. That is why the public debate tends to move away from server counts and toward land use, even when the technical discussion starts with power.
The land issue also affects permitting strategy. Larger sites need more room for substations, setbacks, and support structures, which means the visible footprint often includes more than the main building. In practical terms, the site-selection team is choosing an entire energy-and-logistics envelope, not just a shell.
Community impact is broader than jobs talk
Water, infrastructure, and ecological context matter alongside acreage. Community reporting has highlighted that data center water use can be substantial and that impacts depend heavily on how water is sourced and discharged. The same reporting also stresses that siting near rivers, lakes, or natural areas raises the stakes for local land protection and watershed health. Watershed and community impacts
The land-use question is not whether a project is large in the abstract. It is whether a large project can fit into a place without displacing the natural and community systems already in place. That is why acreage, not just MW, belongs in every serious screening model.
The Bifurcation of Small Edge Nodes and Giant Campuses
The market is splitting into two very different answers to the same demand problem. On one side are edge data centers, generally around 500 kW to 2 MW, built for low-latency workloads and local proximity. On the other are hyperscale campuses, often 100+ MW facilities built for cloud, platform, and AI scale.
That bifurcation makes data center size a misleading single metric. A small edge node may be the right answer for locality and response time, while a campus may be the only viable answer for load concentration and efficiency. The useful question is not “how big is it?” but “what workload class does it support, and what does the grid allow?”
Decision frame: edge for proximity, enterprise for control, colocation for flexibility, hyperscale for load concentration.
The same split also appears in the development pipeline. Broader industry reporting notes more than 1,500 new data centers are in development, and that many are moving into rural areas, while the global base remains concentrated in the U.S., China, and Europe. That combination tells a clear story, growth is becoming more distributed at the edge and more concentrated in giant campuses at the same time. Industry pipeline and concentration
For a site-selection team, the takeaway is simple. Use megawatts to judge feasibility, acres to judge land pressure, and rack density to judge usable capacity. Then place the project in the right class before comparing it to anything else. A site that fails that test is usually not the wrong size, it is the wrong category.
Data Centers List tracks existing, planned, and under-construction facilities in a searchable directory, so teams can compare MW capacity, status, operator, and location in one place. For site-selection work and market analysis, that kind of structure helps separate active capacity from pipeline projects and makes the land and power story easier to read. Visit Data Centers List to review facilities, benchmark markets, and check how scale changes from edge nodes to hyperscale campuses.