Data Center Risks: A Practical Guide to Key Threats
Explore the most common data center risks, from outages and water stress to cyber threats, and learn proven strategies to monitor, mitigate, and protect
17 min read
A data center outage is no longer a remote disaster scenario. The Uptime Institute's 2026 outage analysis found that one in five outages exceeded $1 million in total cost, while its 2025 Global Data Center Survey found that 50% of operators experienced an impactful or serious outage during the previous three years. Those figures change the risk conversation. The central question isn't whether a facility has a backup generator or a security policy. It's whether operators can identify which failure modes are most likely to create material downtime, environmental exposure, delayed expansion, or loss of stakeholder trust.
Data center risks form a connected portfolio. Power failures can become service outages, climate hazards can disrupt fuel logistics and cooling, water constraints can delay permits, and weak supplier controls can undermine both cyber and physical defenses. A practical program therefore ranks each exposure by likelihood, cost, controllability, and the KPI that reveals deterioration early.
Table of Contents
- Quantifying Data Center Downtime Costs
- A Framework for the Main Categories of Data Center Risk
- Power Failures and Outage Risk
- Water Stress as a Site and Supply Chain Risk
- Climate Hazards and Natural Disasters
- Cyber, Physical, and Supply Chain Security
- Regulatory, Community, and Reputational Exposure
- Building a Continuous Risk Monitoring Practice
Quantifying Data Center Downtime Costs
Downtime cost provides a common financial language for data center risk. Earlier Uptime reporting found that more than half of respondents said their most recent significant, serious, or severe outage cost more than $100,000, while 16% reported a cost above $1 million. The Uptime outage analysis shows why routine incidents warrant attention. A failure does not need to become a regional catastrophe to create a six- or seven-figure event.
Downtime is a convergence failure
An outage often reveals several weaknesses at once. A utility disturbance tests the electrical chain, a UPS fault tests stored-energy resilience, and a cooling failure tests whether thermal loads can be transferred without breaching operating limits. Human error, incomplete procedures, delayed support, and weak change control can turn a recoverable fault into a prolonged interruption.
Power remains a major exposure. Uptime's historical tracking found that power failures accounted for 36% of the biggest public service outages it tracked since January 2016. That finding connects electrical design and maintenance directly to outage frequency, recovery time, and the PUE readings operators use to identify inefficient or deteriorating systems.
Localized incidents and regional events require separate assessments. A single-site failure may affect one availability zone or customer environment. A broader utility or weather event can challenge several facilities simultaneously, especially when sites share a transmission corridor, fuel network, contractor pool, or critical supplier.
Practical rule: Translate every risk-control request into avoided outage exposure, reduced recovery time, protected service capacity, or a measurable PUE improvement.
Outage cost also helps compare less visible threats. Water restrictions can raise WUE or constrain cooling choices. Permit delays can extend grid interconnection time and postpone capacity. Equipment shortages and community objections can prevent expansion or force redesign before a facility operates. These exposures may not appear as downtime on an incident report, but they still carry financial consequences.
The appropriate response is a ranked portfolio. Each risk should have an owner, an early trigger, a linked KPI, and a defined business consequence. That structure directs budget toward exposures that threaten service continuity or planned capacity, while keeping lower-impact concerns in proportion.
A Framework for the Main Categories of Data Center Risk
A usable risk framework connects three elements: threat, mitigation, and metric. The threat describes what can fail or constrain the facility. The mitigation identifies the control that reduces likelihood or impact. The metric tells operators whether the control is working before the risk becomes an outage, cost overrun, or planning failure.
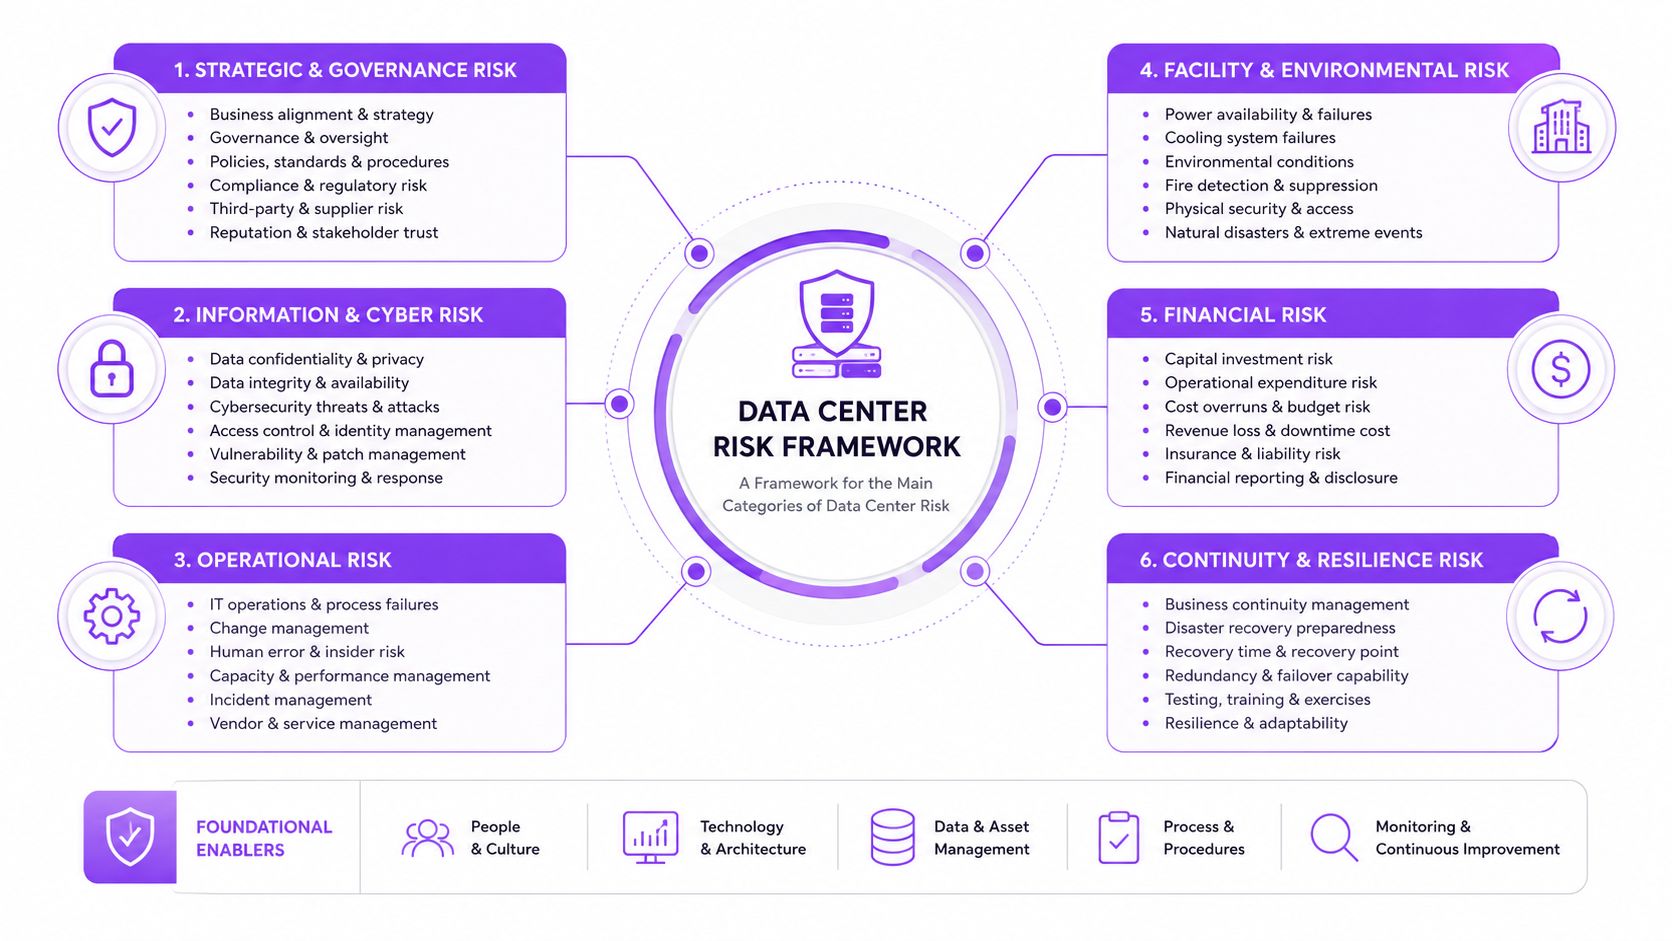
Seven risk families fit this model:
- Power and outage risk: Redundancy, testing, and fault isolation are the main controls. Operators should connect this category to outage frequency, outage cost, UPS test results, and PUE.
- Water and climate risk: Site screening, cooling design, alternate-water planning, and climate adaptation reduce exposure. WUE and basin-level water stress provide a more useful view than facility water consumption alone.
- Natural hazards: Flood, wildfire, wind, seismic, and heat assessments should shape site engineering, insurance, and emergency planning. The relevant metric is hazard-adjusted exposure by facility and critical system.
- Cyber and physical security: Segmentation, identity controls, access monitoring, and tested response procedures protect IT, operational technology, and building systems. Mean time to detect and response-test results make the risk visible.
- Supply chain risk: Provenance checks, supplier resilience reviews, and substitute-equipment planning address dependence on vendors and upstream manufacturing. The metrics include critical supplier coverage and replacement lead times.
- Regulatory risk: Permit milestones, interconnection progress, water allocations, and emissions requirements show whether a project can legally and practically expand.
- Reputational risk: Complaints, incidents, disclosure quality, and customer renewals reveal whether operational problems are becoming a social-license problem.
The categories shouldn't be collapsed into one score. A flood warning may create a clear near-term decision, while reputational deterioration accumulates gradually. Operational risks affect continuity, environmental risks affect resource access and site viability, and strategic risks affect the ability to build, finance, insure, and retain customers.
Power Failures and Outage Risk
Power remains the leading operational weakness, even in facilities built with redundant systems. The 2025 Uptime survey recorded a weighted-average annual PUE of 1.54, while power accounted for 45% of impactful outage incidents. Many involved UPS problems, according to the technical analysis of the survey data. PUE measures efficiency, not fault tolerance. A facility can perform well on energy use while remaining exposed to failures in the electrical chain.
Separate facility controls from utility constraints
Operators should test the complete path from utility service to IT load. The review should cover UPS autonomy, battery condition, switchgear, breakers, generators, controls, transfer sequences, and dependencies between electrical and cooling systems. Nameplate capacity does not establish resilience. Misconfigured protection, degraded batteries, or untested control sequences can still interrupt service.
Recommended controls include:
- UPS validation: Run scheduled autonomy tests under representative load conditions and verify that results meet operating requirements.
- Protection coordination: Revisit breaker settings after major equipment changes so a local fault does not spread through the distribution system.
- Generator readiness: Check fuel quality, starting systems, ventilation, controls, and fuel replenishment arrangements.
- Fault isolation: Test failover and restoration from end to end, including the decisions staff must make during an incident.
Grid-side risk requires a separate assessment. AI workloads are increasing pressure on power and cooling designs, while interconnection delays, transformer availability, and transmission constraints can restrict expansion after a site has been secured. Grid interconnection time should sit beside PUE and outage cost in the investment case. Efficient equipment cannot compensate for an uncertain utility delivery path.
| Root Cause | Approx. Share of Outages | Primary Mitigation |
|---|---|---|
| Power-related incidents | 45% of impactful incidents, according to the technical analysis of the survey data | UPS health monitoring, coordinated protection, generator testing, and end-to-end isolation tests |
| Public service power failures | 36% of the biggest tracked outages since January 2016, according to Uptime's outage analysis | Diverse utility feeds, resilient distribution, maintenance discipline, and tested transfer procedures |
| Other operational causes | Not specified in the verified data | Change control, staff training, vendor escalation, and integrated incident exercises |
PUE supports efficiency and load planning. Outage cost shows whether resilience spending protects business operations. Budget requests are stronger when each control is tied to a defined failure mode, its expected effect on service continuity, and the time required to reduce exposure.
Water Stress as a Site and Supply Chain Risk
A low on-site WUE does not establish low water risk. WUE measures facility water use during operation, while the wider footprint can include water consumed by electricity generation and semiconductor manufacturing. A 2026 analysis reported by Route Fifty estimated that off-site water use may represent around 71% of a data center's total water footprint.
Site approval should therefore test two dependencies at once: the facility's direct cooling demand and the water intensity of its power and equipment supply. A site may control cooling consumption while relying on water-intensive generation or suppliers located in water-stressed manufacturing regions. Ceres' 2025 analysis of data center water stress says data center growth could increase water stress in already strained basins by up to 17% annually, with greater pressure during peak seasons.
The operating KPI is WUE. The investment decision requires more.
ISO/IEC 30134-9 defines Water Usage Effectiveness as the measure of water consumption during the use phase of a data center. Operators should pair WUE with basin stress, drought restrictions, utility reliability, and supplier disclosures. This connects water performance to site continuity and supply-chain availability rather than treating it as a facilities-only metric.
Use a site review that covers:
- Cooling design: Compare air, liquid, hybrid, and recycled-water systems against seasonal conditions, not annual averages alone.
- Drought runbooks: Specify operating changes, customer communications, alternate supplies, and escalation points before restrictions begin.
- Contract protections: Address water availability, quality, interruption, and allocation in site and utility agreements.
- Supplier screening: Require critical equipment and chip suppliers to disclose water dependencies and contingency plans.
The thresholds below are management targets, not verified industry standards. They provide internal guardrails, subject to engineering validation and local regulatory review.
| Exposure Type | Primary KPI | Typical Threshold | Key Mitigation |
|---|---|---|---|
| Direct cooling use | WUE | Internal target such as below 1.0 L/kWh, subject to design validation | Efficient cooling, reclaimed water, and closed-loop systems |
| Basin exposure | Regional water-stress score | Site-specific risk limit | Basin screening, seasonal modeling, and alternate sourcing |
| Electricity-related water | Off-site water footprint | No universal threshold established | Grid-mix review and lower-water energy procurement |
| Supplier exposure | Supplier water audit coverage | Full coverage for critical suppliers | Disclosure requirements, dual sourcing, and contingency planning |
WUE belongs in the operating dashboard, while basin and supplier exposure belong in the site and sourcing decision. Water is an infrastructure dependency, and unmanaged upstream exposure can remain high even when facility-level efficiency improves.
Climate Hazards and Natural Disasters
Physical climate exposure now affects data center siting and portfolio design. Recent analysis classified 6.25% of the world's data centers as high risk and 15.79% as moderate risk, so about 22% faced meaningful climate-related threat at the time of the analysis. The same climate-risk assessment projects that by 2050, high-risk sites could reach 7.13% and moderate-risk sites 19.6%, while low-risk sites could fall to 73.27%.
A broader industry summary reported that nearly 80% of global data center capacity faces heightened acute hazards, including flooding, high winds, and wildfire, while 54% sits in markets exposed to chronic heat or drought stress. These figures do not define a universal design standard. They set a screening requirement before operators commit to power, cooling, insurance, or expansion assumptions.
Connect hazards to operating KPIs
- Flooding: Water can disable electrical rooms, fuel systems, access roads, and cooling equipment. The relevant KPI is outage cost, because a flooded support system can create a facility-wide failure even when servers remain dry. Raise critical plant above the applicable flood level and protect drainage paths.
- Wildfire and smoke: Smoke can overwhelm air-intake filtration and restrict staff access. Track air-quality triggers, filtration performance, and fuel delivery lead time. Road disruption can turn a short event into a longer outage.
- High winds: Wind can damage roofs, cooling equipment, transmission assets, and external fuel systems. Assess structural hardening with protected storage and restoration time.
- Seismic events: Batteries, switchgear, racks, and piping require appropriate bracing. Structural survival does not ensure service continuity if internal equipment moves.
- Extreme heat: Outdoor equipment can derate while cooling demand rises. Monitor PUE against the thermal operating envelope, then budget for heat-rated electrical equipment and additional cooling margin.
Climate hazards also affect water and power indirectly. Heat and drought can restrict cooling supply, raise WUE, or reduce the reliability of generation and transmission. Floods and wildfires can delay replacement equipment, fuel, and technician access. These exposures belong in site selection, maintenance inventory, and supplier continuity reviews, not only in emergency plans.
A hazard score should influence insurance terms, emergency stock, capital reserves, and customer placement. It also belongs in portfolio analysis. Two facilities at separate addresses may still share the same regional grid, watershed, road network, or weather system. Geographic diversity reduces concentration only when infrastructure and utility dependencies differ as well.
For market context, operators can review facility information such as the Deep Resilience Centre in Luxembourg West Windhof alongside local hazard, utility, and permitting data.
| Hazard | Facility Share at Risk | KPI or Failure Mode | Primary Control |
|---|---|---|---|
| Acute flooding, wind, and wildfire exposure | Nearly 80% of global capacity | Outage cost, access loss, cooling disruption, or air-intake contamination | Site-specific hazard engineering, protected plant, filtration, and logistics plans |
| Chronic heat and drought | 54% of global capacity in exposed markets | PUE, WUE, cooling stress, and equipment derating | Heat-rated systems, WUE controls, and drought procedures |
| High or moderate overall climate risk | About 22% of global data centers today | Combined asset exposure and recovery time | Risk-adjusted capital planning, insurance review, and portfolio diversification |
Cyber, Physical, and Supply Chain Security
A cyber incident can become a facility outage through shared credentials, compromised firmware, or unauthorized access to control equipment. These risks should be assessed against the operating metrics that determine business impact: outage cost, recovery time, and the availability of cooling and power systems. A secure network does not protect a site if a contractor can reach a sensitive control area or a supplier cannot support replacement hardware.
The control design should follow the path an attacker or defective component could take. Network microsegmentation separates IT, operational technology, and building-management traffic. Administrative access requires strong identity verification, session logging, and narrowly scoped privileges. Building-management protocols also need anomaly detection, since unusual commands may affect both service continuity and physical safety.
Physical and supplier controls should be tested as one system:
- Access control: Use monitored badge access, mantraps, visitor escorts, and reviewable entry records for sensitive areas.
- Hardware provenance: Validate serial records, signed firmware, chain of custody, and tamper evidence before equipment enters production.
- Supplier assurance: Require security attestations, incident-notification terms, privileged-access controls, and recovery commitments from critical vendors.
- Testing: Run social-engineering exercises, red-team assessments, and recovery drills that include facilities and engineering staff.
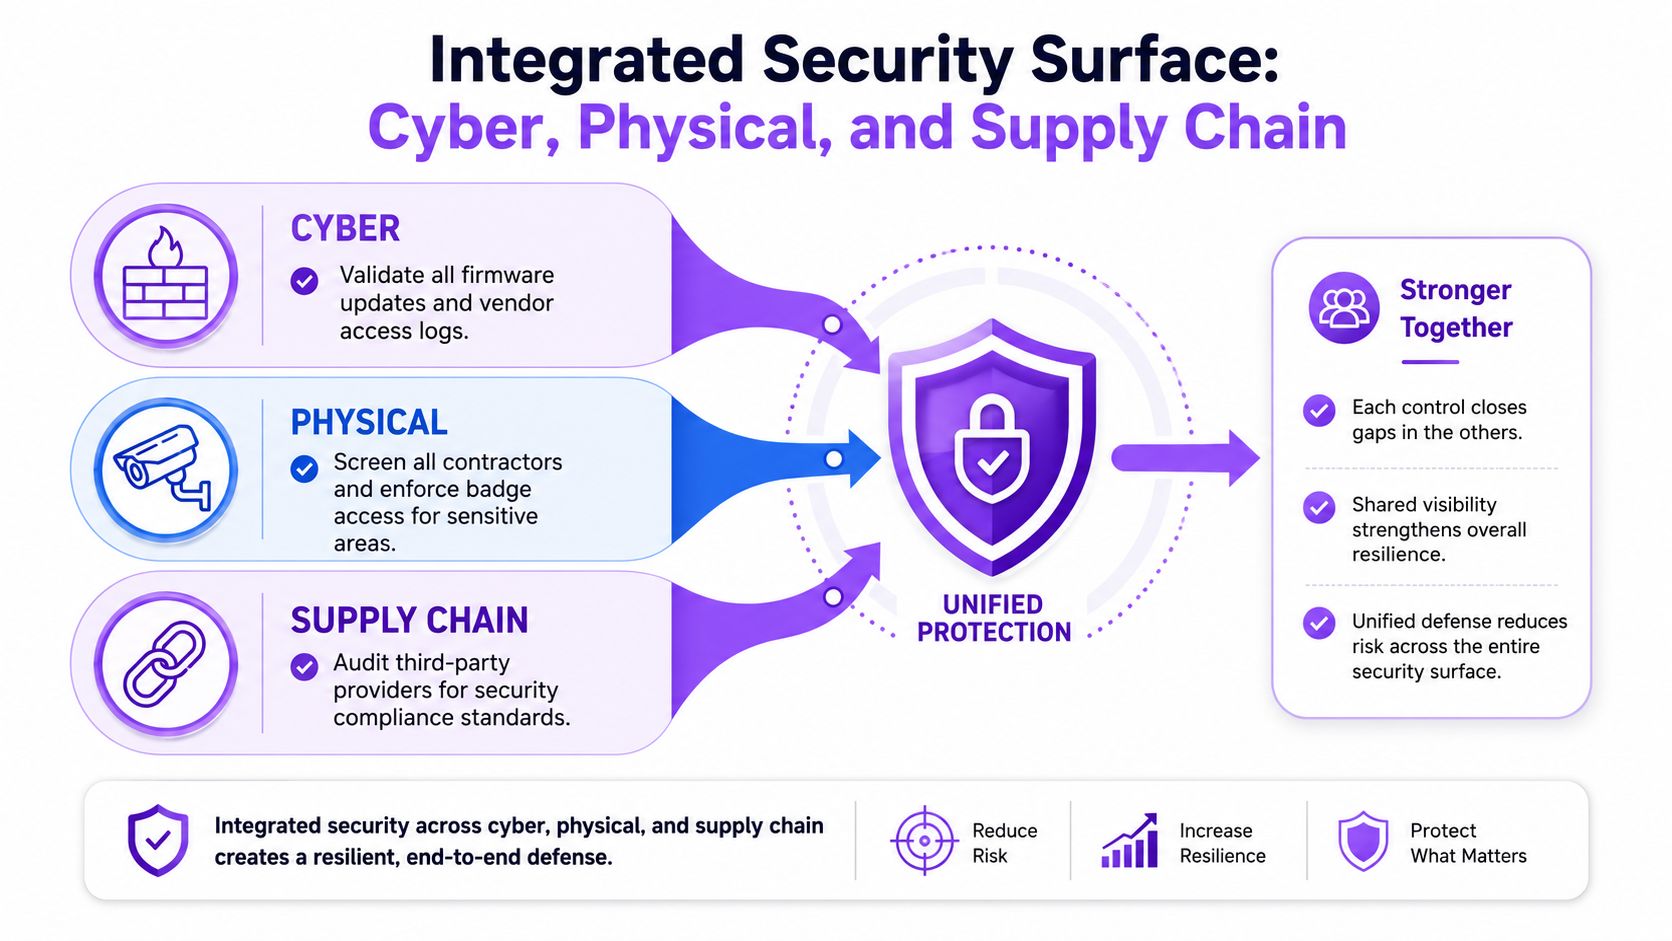
Security leaders need operating evidence, not only compliance status. Track mean time to detect, mean time to contain, the share of critical suppliers with validated provenance, unresolved privileged-access findings, and red-team remediation closure. A recurring anomaly in building-management traffic may warrant faster escalation than a routine policy exception because it can disrupt service while creating safety exposure.
Supply-chain review should also connect directly to outage cost and recovery time. A financially stable vendor can still create risk through long replacement lead times, sole-source components, or inaccessible firmware support. Procurement, security, facilities, and operations teams should identify which components can stop service, record their replacement paths, and test qualified substitutes before an incident occurs. That approach exposes indirect dependencies that network controls alone cannot measure.
Regulatory, Community, and Reputational Exposure
Regulatory risk can limit capacity before a facility is built. A technically suitable site with contracted demand may still miss its operating target if power interconnection, water allocation, emissions controls, discharge rules, or zoning approvals remain unresolved. Track those dependencies beside PUE, WUE, outage cost, and interconnection time. A rising approval lead time can consume capital before the facility generates revenue.
Community response affects the operating plan
Noise, diesel emissions, traffic, water demand, and land use often determine how much mitigation a project needs. One complaint does not establish a project threat. A repeated pattern can increase review intensity, delay approvals, and add construction or operating expense. The same logic applies after an outage or contamination event, when a technical failure can become a customer-retention and public-trust issue.
Use a short decision register rather than a generic compliance checklist:
- Permit-to-power time: Record the path from application to energization, and assign milestone slippage to a named owner.
- Water allocation status: Monitor approved supply, seasonal restrictions, discharge conditions, and backup sources. These indicators connect community exposure to WUE and continuity planning.
- Community complaints: Classify noise, traffic, emissions, water, and construction concerns, then measure resolution time and recurrence.
- Disclosure quality: Reconcile public statements about capacity, water, energy, and resilience with measured results or clearly labeled estimates.
- Customer impact: Link incidents and environmental events to SLA discussions, renewals, and escalation patterns, including the resulting outage-cost exposure.
A facility profile such as the Amazon Louisiana data center campuses belongs in a wider local-context review. It does not replace planning records, utility documentation, water approvals, or regulatory filings.
Compliance should function as a leading KPI, not merely a final gate. Slipping permit milestones, tightening water allocations, or rising complaints signal a changed risk profile before construction starts. Capital planning should adjust then, while options remain available, rather than after delay has created stranded expenditure.
Building a Continuous Risk Monitoring Practice
A risk register becomes useful when every entry contains four fields: KPI, data source, owner, and review cadence. Without those fields, risk discussion tends to become a periodic presentation rather than a control system. The register should also record the trigger that moves an item from monitoring to executive escalation.
Start with a practical operating rhythm
Power teams can combine PUE, UPS test outcomes, generator readiness, incident records, and utility reliability indicators. Water teams should pair WUE with basin-stress data, seasonal restrictions, and supplier disclosures. Climate owners can maintain facility-level hazard records and monitor official weather, geological, and emergency feeds.
Security teams need both technology and physical signals. SIEM activity, privileged-access exceptions, building-management anomalies, hardware provenance audits, and exercise findings should appear together. Regulatory owners should track permit milestones, interconnection progress, water approvals, and community complaints rather than waiting for a formal rejection.
The Data Centers List predictive modeling resource can sit alongside public planning records and internal operational data when analysts are building location and pipeline views. Data Centers List itself may also provide facility, status, capacity, operator, and local-context records for comparative market analysis, with disclosed and AI-estimated figures identified separately.
| Risk Category | Primary KPI | Data Source | Cadence |
|---|---|---|---|
| Power and outage | PUE, UPS test result, outage cost, interconnection milestone | BMS, electrical test records, incident system, utility correspondence | Monthly operational review, quarterly executive review |
| Water | WUE, basin-stress status, allocation and restriction status | Metering, water authorities, basin assessments, supplier disclosures | Monthly in stressed basins, quarterly elsewhere |
| Climate and natural hazards | Hazard score, alert status, critical-system exposure | Official weather, geological, flood, wildfire, and emergency feeds | Continuous alerts, quarterly planning review |
| Cyber and physical security | Detection and containment time, access exceptions, exercise findings | Security monitoring, access systems, audit records | Weekly operations, monthly risk review |
| Supply chain | Critical supplier coverage, component lead time, provenance status | Procurement system, supplier attestations, asset records | Monthly |
| Regulatory and community | Permit slippage, water approvals, complaint volume | Planning records, legal register, community-relations log | Monthly during development, quarterly after operation |
| Reputation | Incident disclosures, customer escalations, renewal signals | Communications records, customer management systems, board reporting | Monthly or after material incidents |
A simple RACI prevents gaps. The facilities leader can be accountable for power, cooling, and water controls. The security leader can own cyber and physical safeguards. Development and legal teams can own permitting, while procurement owns supplier continuity. The executive sponsor remains accountable for cross-category trade-offs, especially when resilience spending competes with expansion.
Use low-cost data before buying more systems
An analyst can begin with a spreadsheet or shared register populated from:
- Utility documentation: Interconnection milestones, planned maintenance, and service-quality notices.
- Facility telemetry: PUE, WUE, UPS alarms, battery tests, generator status, and cooling limits.
- Public hazard feeds: Flood, wildfire, severe-weather, seismic, and heat alerts.
- Planning records: Zoning decisions, water permits, discharge rules, and hearing documents.
- Internal security records: Access exceptions, supplier audits, incident tickets, and exercise results.
The first review should identify missing data, not manufacture a false precision score. A qualitative high, medium, or low rating is defensible when the evidence and uncertainty are recorded. Over time, the register can support capital prioritization, customer placement, insurance discussions, and board decisions because each exposure is tied to an observable operating condition.
Operators and developers can use Data Centers List to compare existing, planned, and under-construction facilities by location, status, operator, capacity, and available local-context information. Visit the directory to strengthen market screening and connect facility-level visibility with the power, water, climate, and permitting checks that shape data center risk.