Data Center Power Usage Effectiveness Explained Simply
Learn what data center power usage effectiveness means, how it is calculated, what good PUE looks like, and how operators improve it
15 min read
PUE is calculated as total facility energy divided by IT equipment energy, and the 2025 weighted industry average is 1.54. That means a typical surveyed facility uses 1.54 units of total energy for each unit delivered to IT, although the comparison only makes sense when the measurement boundaries match.
Why does a facility with a lower PUE sometimes make a less meaningful efficiency claim than one with a higher figure? The answer usually isn't the decimal itself. It's what the operator included in the numerator and denominator, how the readings were collected, and whether the comparison involves similar climates, workloads, and operating conditions.
Data center power usage effectiveness gives operators a useful language for separating computing energy from the energy required to support it. Used carefully, it helps identify cooling losses, power distribution waste, and operational drift. Used casually, it can turn into a polished but incomplete marketing number.
Table of Contents
- Why PUE Matters and What You Will Learn
- The PUE Formula and Measurement Boundaries Explained
- Industry Benchmarks and Where PUE Stands Today
- The Main Drivers Behind PUE Variance
- How to Improve PUE in Existing and New Facilities
- How PUE Fits With Other Efficiency and Sustainability Metrics
- Common Misuses of PUE and How to Read Vendor Claims
- Putting It All Together as a Practical Reader's Checklist
Why PUE Matters and What You Will Learn
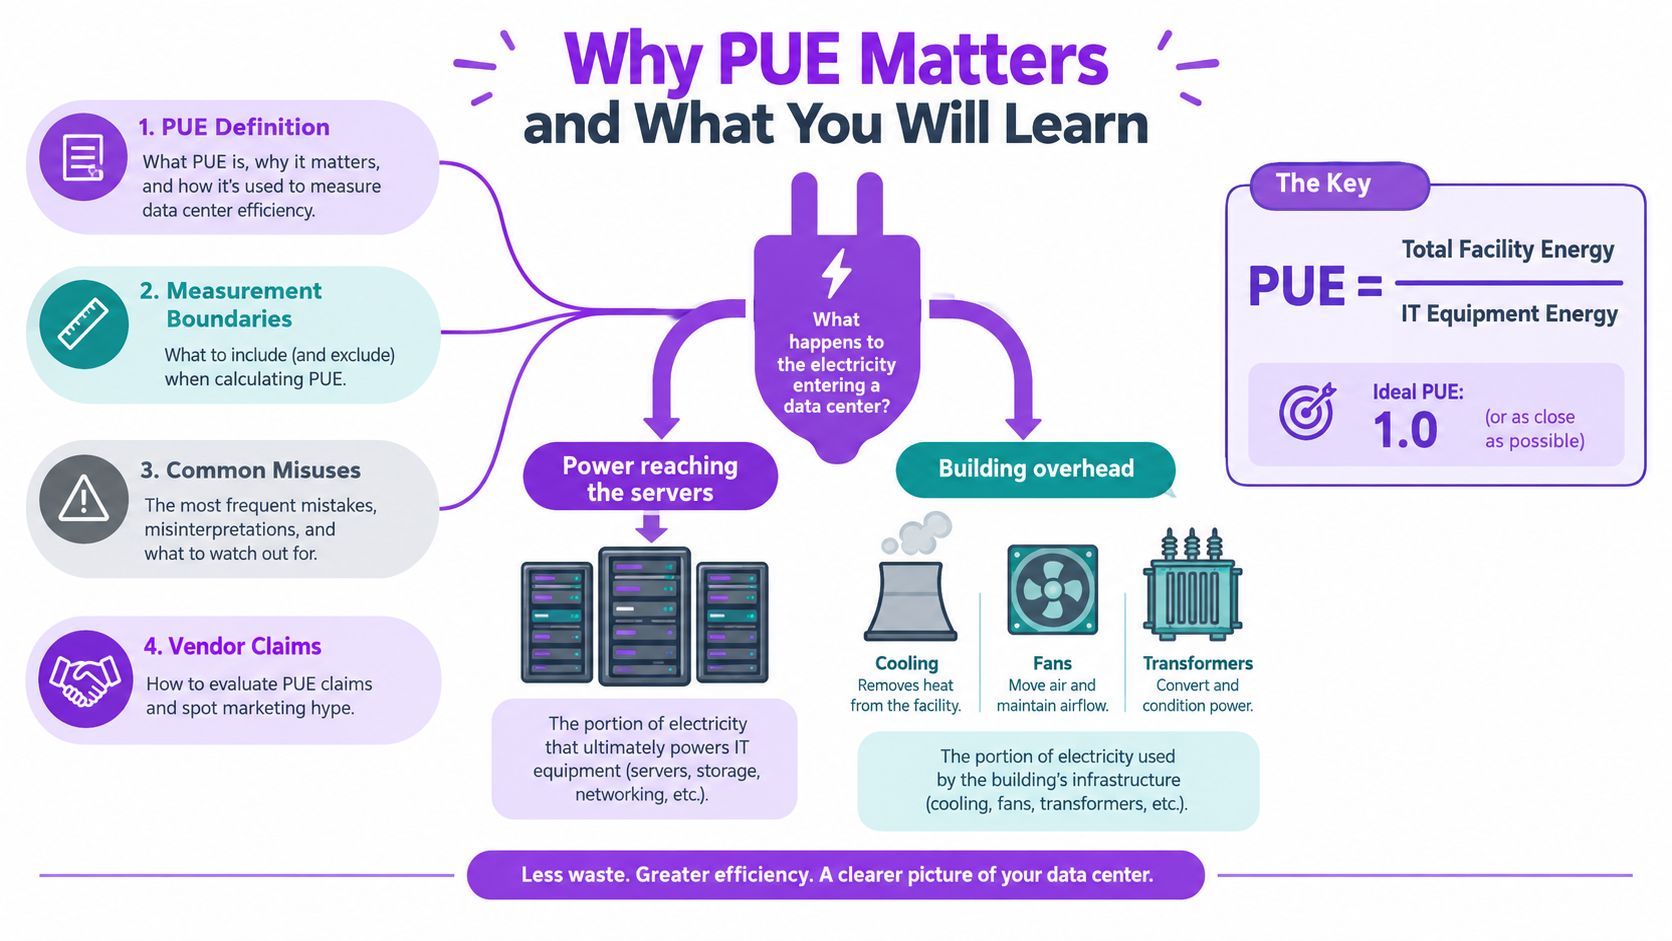
Every operator eventually asks a practical question: how much of the electricity entering the facility reaches the servers, and how much runs the building around them? Power Usage Effectiveness, or PUE, was developed to answer that question with a single ratio. It became a standardized data center efficiency metric after its introduction in 2006, and it was later adopted in ISO/IEC 30134-2:2016. The Uptime Institute annual survey report provides the most useful long-running context for how the industry has moved.
The formula is simple:
PUE = Total Facility Energy / IT Equipment Energy
A PUE of 1.0 is the theoretical floor. It would mean every unit of energy entering the measured facility boundary reaches IT equipment, with no overhead for cooling, power distribution, lighting, or other support systems. Real facilities must operate support systems, so the ratio rises above 1.0.
The current reference point is the 2025 weighted average of 1.54, while the 2024 industry average was 1.56 according to the same Uptime Institute survey source. In practical terms, a PUE of 1.54 means that each unit of energy used by IT is accompanied by 0.54 units of facility overhead, provided both measurements use the same boundary and time period.
The useful skill is comparison, not memorization
A single PUE value doesn't tell an operator whether a facility is well designed for its climate, whether the IT load is fully utilized, or whether the reporting boundary excludes important loads. The number becomes useful only when the reader understands those conditions.
This article builds four practical skills:
- Boundary literacy: identifying where facility and IT measurements begin and end.
- Benchmark judgment: comparing like-for-like sites rather than accepting the lowest published figure.
- Improvement planning: connecting the PUE problem to airflow, cooling, distribution, utilization, or measurement quality.
- Metric selection: knowing when PUE needs support from carbon, water, or clean-energy measures.
Facility directories such as Data Centers List can help analysts place individual sites in a broader market context, but directory data and operator disclosures still need careful interpretation. A disclosed IT capacity, an estimated capacity, and a metered PUE are different types of evidence.
Practical rule: A PUE number is a measurement result, not a verdict. The boundary statement is part of the result.
The PUE Formula and Measurement Boundaries Explained
The formula is simple. The hard part is deciding what counts as facility energy and what counts as IT energy. Without that boundary, two identical PUE values can describe different operating conditions.
Total facility energy is the energy entering the defined facility boundary. IT equipment energy is the energy used by the computing, storage, and networking equipment included in the selected IT boundary. PUE divides the first figure by the second. Cooling, power distribution, lighting, and other support systems appear in the facility total but not in the IT total.
The data center benchmarking guide from Lawrence Berkeley National Laboratory explains why consistent measurement matters. A PUE of 1.5 means 0.5 kWh of non-IT overhead for every 1 kWh delivered to servers. A value of 1.0 is the theoretical floor, because any support energy raises the ratio.
The boundary categories
PUE categories identify the point where measurements are taken. They do not grade a facility's efficiency. They show how broad the measurement is and how closely it reaches the equipment using the power.
| Category | Measurement Point | Typical Reported Range | Use Case |
|---|---|---|---|
| Category 0, basic | Utility meter or equivalent facility intake | No universal range | High-level site screening |
| Category 1, intermediate | Input to IT equipment | No universal range | Facility-level operational benchmarking |
| Category 2, advanced | PDU output | No universal range | More focused IT delivery analysis |
| Category 3, device-level | Individual device level | No universal range | Detailed equipment and workload analysis |
The category alone cannot make reports comparable. Climate, load level, season, included support systems, and the meter location can all affect the result. A range without those details creates false precision. Treat the categories as measurement descriptions, not efficiency grades.
Why partial PUE creates trouble
A report may use PUEpartial while leaving out cooling equipment, switchgear, generator losses, office loads, or another support system. That can answer a focused engineering question, but it should not be treated as equivalent to full-facility PUE.
Two facilities can both report 1.4 and still have different efficiency profiles. One may measure at the utility meter and include the complete facility. The other may measure at a PDU output and exclude upstream losses. The decimal matches, while the boundary and operational story do not.
Before comparing a vendor report or sustainability filing, check three points: the facility meter, the IT meter, and the loads excluded from each total. If any of those are unclear, record the value as a limited comparison rather than an apples-to-apples benchmark.
Industry Benchmarks and Where PUE Stands Today
What does a lower PUE tell you about a facility? It shows how much total facility energy supports each unit of IT energy, but the comparison only works when the sites use similar boundaries and operating conditions.
The largest early gains came from straightforward facility improvements. Uptime Institute survey data places the average near 2.5 in 2007, falling to about 1.65 in 2014, according to the 2025 Global Data Center Survey. Better airflow management, containment, and related measures removed much of the avoidable overhead.
The decline has since slowed. The survey reports an industry average of 1.56 in 2024 and a 2025 weighted average of 1.54. These figures show substantial improvement, while also indicating that further reductions often depend on controls, site-specific cooling design, tighter measurement, or major capital work.
Benchmarking requires comparable groups
A global average provides context, not a universal target. The IEEE overview of PUE explains that climate, utilization, and measurement boundary can materially change the result. It describes 1.2 as a practical target for strong designs. Values below 1.1 generally require aggressive free cooling, liquid cooling, or direct evaporative systems.
| Operator Type | Nordic Region | North America | Tropical Asia | Global Average |
|---|---|---|---|---|
| Hyperscale fleet | Values can approach 1.06 to 1.10 with controlled airflow and favorable conditions | Site and workload conditions determine the result | Higher cooling demand requires stronger heat-rejection design | Reported fleet values can approach 1.06 to 1.10 |
| Large colocation | Free cooling can reduce mechanical cooling overhead | Comparisons usually work within the same local market | Mechanical cooling can run for much of the year | Often assessed against the 1.54 to 1.58 survey context |
| Traditional enterprise | Building age, airflow, and controls often dominate | Older sites may retain substantial support overhead | Hotter conditions can increase cooling demand | Often above modern purpose-built designs |
| Strong new design | Can approach the practical 1.2 target with suitable conditions | Can approach 1.2 when engineered and operated well | Reaching 1.2 is harder without advanced cooling | 1.2 is a design target, not a universal average |
Use the table as a screening framework, not a list of guaranteed regional results. A reader reviewing facilities through a data center directory and market map should match the boundary definition, load condition, reporting period, and climate context before comparing values.
A low PUE in a favorable climate does not prove that the same design will perform identically in a hot, humid market.
Hyperscale figures around 1.06 to 1.10 usually depend on tightly controlled airflow, efficient power trains, favorable environmental conditions, and consistent operating practices. They are not a fair baseline for every enterprise facility.
The Main Drivers Behind PUE Variance
PUE changes when the facility overhead changes relative to IT energy. That relationship is why the same cooling plant can look efficient at a high IT load and inefficient at a lightly loaded site. The building still consumes baseline energy, while the denominator becomes smaller.
The Data Centers List operator directory can help organize facilities by operator, but operator identity alone doesn't explain PUE. The decisive variables are usually physical and operational.
Cooling architecture
Air-cooled raised-floor designs can lose energy through bypass airflow, recirculation, and unnecessary fan pressure. Hot and cold aisle containment improves separation. Rear-door heat exchangers and liquid cooling can address higher-density loads more directly, although their total result depends on pumps, heat rejection, controls, and the measurement boundary.
The most relevant engineering question isn't “Which technology has the lowest advertised PUE?” It's “Which source of cooling overhead is dominant at this site?” A facility with poor airflow management may gain more from blanking panels and containment than from replacing major mechanical equipment.
Climate and utilization
Climate sets the available cooling options. A cool site can use outside-air or economizer operation more often, while a tropical site may need mechanical cooling for much of the year. That doesn't make tropical facilities poorly engineered. It means the achievable floor is shaped by environmental conditions as well as equipment selection.
Utilization matters too. A facility designed for dense racks but operating at a much lower actual IT load still runs pumps, controls, fans, lighting, and electrical equipment. Fixed overhead is then divided across fewer IT kilowatt-hours, pushing the ratio upward.
Measurement choice
The four drivers can be summarized as a diagnostic matrix:
| Driver | Configuration A, Worse | Configuration B, Better | Typical PUE Delta |
|---|---|---|---|
| Airflow | Bypass air and recirculation | Containment, blanking, sealed openings | Site-specific, no universal delta |
| Cooling | Mechanical cooling without economizer use | Economizer, free cooling, optimized controls | Site-specific, climate-dependent |
| Utilization | Low IT load with fixed overhead | Higher, steadier IT load | Ratio rises or falls with denominator |
| Boundary | Partial PUE excluding support loads | Full, disclosed facility boundary | Reported value can be artificially lower |
These drivers also explain why disclosed and estimated facility profiles must be separated. A metered operator report can show actual operating performance under a stated boundary. An AI-estimated profile can support market analysis, but it shouldn't be treated as a metered PUE result.
How to Improve PUE in Existing and New Facilities
Existing facilities usually improve PUE by removing waste from systems already in place. New facilities have more freedom to avoid that waste through site selection, layout, distribution, and cooling architecture. The financial case should start with the dominant loss, not with a fashionable technology list.
Retrofit sequence for operating sites
An operator can begin with low-disruption checks:
- Airflow control: Install blanking panels, seal cable openings, remove under-floor obstructions, and improve hot or cold aisle containment.
- Temperature strategy: Raise rack inlet temperature setpoints within the applicable equipment and operating limits. Higher setpoints can reduce mechanical cooling demand, but they require disciplined monitoring.
- Fan and pump control: Evaluate EC fans and variable-speed drives so airflow and water movement follow actual load rather than a fixed maximum.
- Cooling optimization: Review chiller sequencing, economizer operation, and control logic across seasons.
- Continuous analysis: Use facility and rack telemetry to identify simultaneous heating and cooling, unnecessary pressure, and underloaded equipment.
The order matters. Airflow corrections often expose control problems that were previously hidden. Replacing equipment before fixing containment can leave the root cause untouched.
Design choices for new builds
A new facility can model the climate before selecting the site. Free-cooling availability, humidity conditions, water constraints, grid characteristics, and expected rack density should appear in the early design brief.
Purpose-built facilities can also make hot-aisle containment the default, reserve space for liquid cooling, and design distribution around the expected high-density workload. High-voltage DC distribution may reduce conversion stages in some architectures, but its suitability depends on equipment compatibility, protection design, maintainability, and the selected boundary.
| Measure | Typical PUE Impact | Existing Facility | New Build |
|---|---|---|---|
| Blanking and sealing | Can reduce avoidable airflow waste | Usually practical | Should be built into commissioning |
| Aisle containment | Often useful where recirculation exists | Retrofit possible | Easy to integrate |
| Variable-speed drives | Reduces unnecessary fan or pump work | Requires compatibility review | Designed from the start |
| Economizer or free cooling | Strongly climate-dependent | May require major modification | Best evaluated during site selection |
| Liquid-ready cooling | Important for dense future loads | May need structural and plumbing work | Can be planned into the thermal design |
| High-voltage DC distribution | Architecture-dependent | Complex retrofit | Easier to evaluate before construction |
Once a facility is already below 1.3, each additional improvement generally requires more careful justification. A site selector should request modeled seasonal performance, boundary definitions, expected IT load, and commissioning assumptions before approving a premium design.
How PUE Fits With Other Efficiency and Sustainability Metrics
PUE answers one narrow question: how much facility energy supports each unit of IT energy? It doesn't describe the carbon intensity of the electricity, the water consumed for cooling, or how closely clean-energy supply follows the facility's demand.
That limitation matters when two sites have different energy systems. A facility with a PUE of 1.15 in a carbon-intensive grid can have a larger emissions impact than a facility with a PUE of 1.30 supplied by a much lower-carbon electricity mix. PUE improves the efficiency of the electrical infrastructure, but it doesn't determine the environmental effect of the electricity itself.
| Metric | What It Measures | Best Used For | Blind Spot |
|---|---|---|---|
| PUE | Facility energy relative to IT equipment energy | Operational infrastructure benchmarking | Doesn't measure carbon, water, or IT work quality |
| CUE | Carbon emissions associated with data center energy | Carbon and emissions reporting | Depends on carbon accounting and electricity factors |
| WUE | Water consumption associated with IT operations | Water-risk and cooling assessments | Doesn't show electrical efficiency |
| CFE | Alignment between energy use and carbon-free energy supply | Clean-energy procurement and matching | Doesn't replace facility efficiency measurement |
Choosing the right combination
PUE alone can be sufficient for a tightly scoped facilities comparison when the sites share a boundary, climate, load profile, and reporting period. It becomes misleading in sustainability filings, ESG disclosures, water-scarce regions, or procurement decisions where electricity source matters as much as facility overhead.
A practical rule is straightforward:
- Use PUE for operational efficiency.
- Pair PUE with CUE for carbon.
- Add WUE where water stress affects the community or cooling strategy.
- Use CFE to understand the relationship between consumption and carbon-free energy supply.
Operational teams can also reduce environmental impact by shifting flexible workloads away from carbon-intensive periods. Guidance on start/stop scheduling for sustainability can complement facility-level efficiency work, but workload scheduling doesn't replace accurate PUE measurement.
Common Misuses of PUE and How to Read Vendor Claims
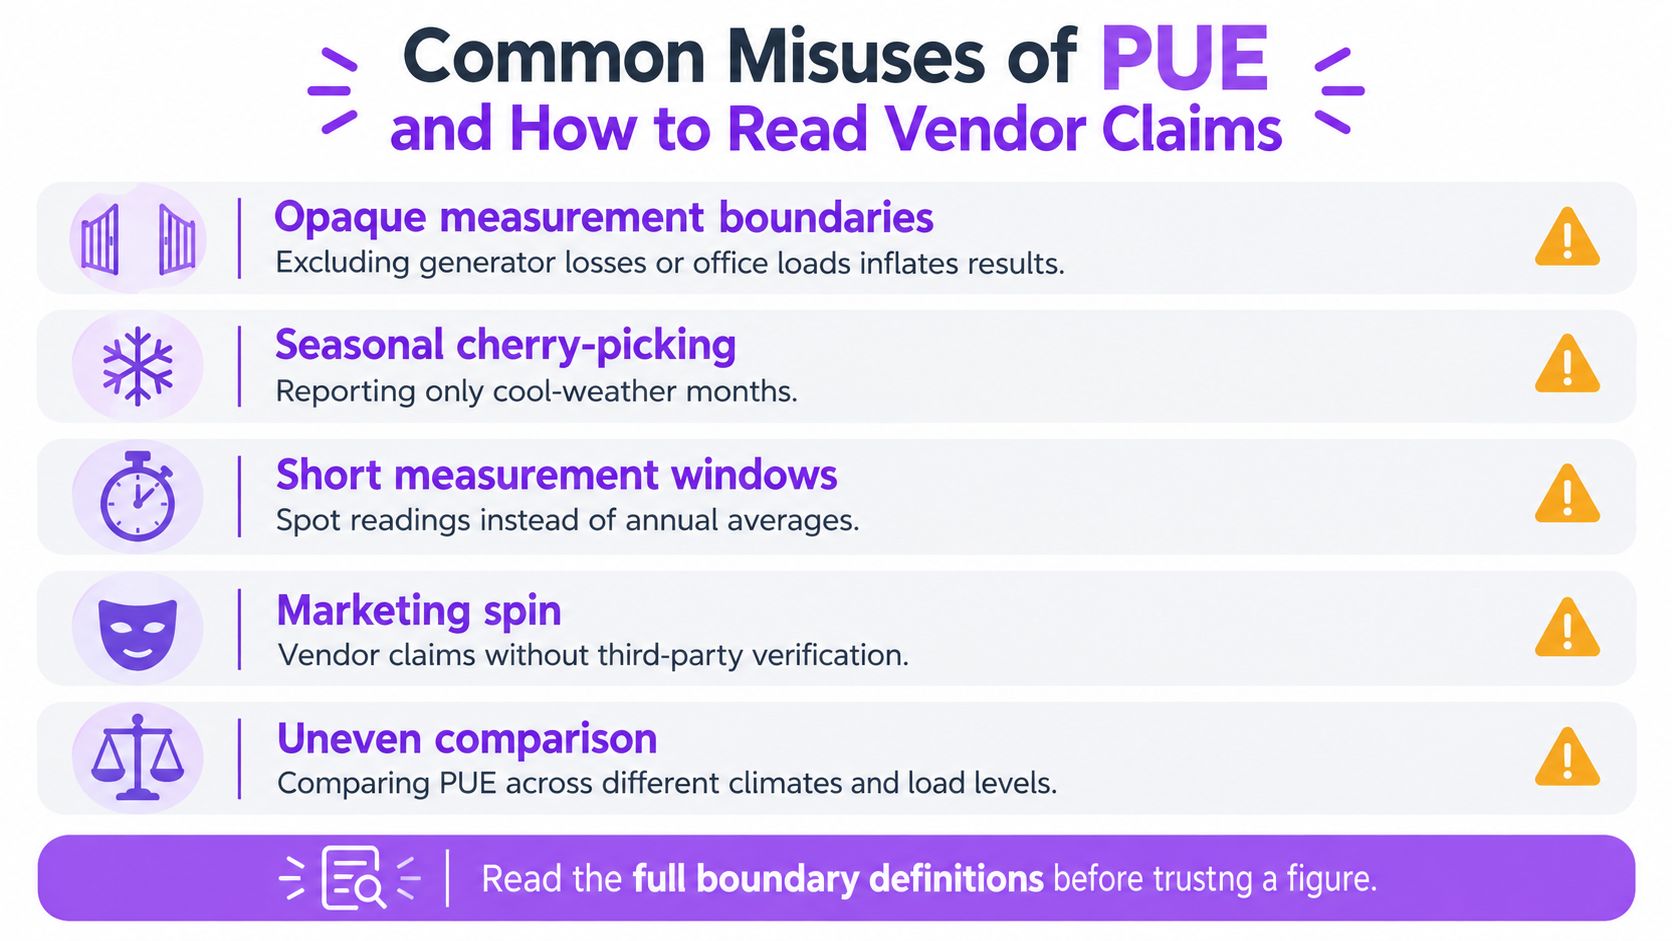
PUE becomes unreliable as a comparison when the report hides the measurement conditions. The most common problem isn't arithmetic. It's selective inclusion.
A vendor claim deserves closer review when it:
- Omits the boundary: Generator losses, office loads, or upstream equipment may sit outside the reported figure.
- Uses partial PUE: Cooling or switchgear may be excluded, making the ratio appear lower.
- Substitutes estimates for meters: Modeled values may be useful, but they aren't equivalent to measured readings.
- Cherry-picks a season: Cool-weather results can hide warmer-period performance.
- Reports a short window: A spot reading doesn't represent an annual operating pattern.
A constructive review asks five questions:
- What boundary definition was used?
- Is the figure an annual average or the best month?
- Are the values metered, modeled, or mixed?
- How was IT load measured?
- Does the claim concern PUE only, or does it also describe renewable-energy matching?
A credible report should state the measurement point, included loads, time coverage, and data collection method. Without those details, the number can still describe a local condition, but it shouldn't carry the weight of a like-for-like benchmark.
Putting It All Together as a Practical Reader's Checklist
A facility review can stay focused with four short checks:
- Confirm the boundary: Record the measurement category, included support loads, IT measurement point, and reporting period.
- Test benchmark realism: Compare the result with the 1.54 2025 weighted average only when the boundary and operating context are comparable. Then check climate, utilization, and regional peers.
- Sequence improvements: Identify whether airflow, cooling, controls, utilization, or measurement quality drives the gap before evaluating capital work.
- Add the missing metrics: Include CUE for carbon, WUE for water, and CFE for clean-energy alignment when the decision involves sustainability or site impact.
PUE is a starting point, not a verdict. The same number can describe very different facilities depending on what sits inside the boundary.
Data Centers List provides an interactive directory and map of active, planned, and under-construction data centers, with operator, location, capacity, status, and disclosed or AI-estimated data clearly distinguished. Visit Data Centers List to compare facilities and markets with the boundary and context questions that make PUE analysis more reliable.