Data Center Power Requirements Explained
Learn data center power requirements from IT load and PUE to redundancy and utility feeds, with worked examples for colocation, hyperscale, and edge sites.
17 min read
Data centers consumed an estimated 415 TWh of electricity worldwide in 2024, about 1.5% of global electricity use. The International Energy Agency's analysis of data-center and AI energy demand projects that consumption could reach approximately 945 TWh by 2030, just under 3% of worldwide electricity use. Those figures describe energy consumed across the sector, but they don't answer the question a developer, operator, or utility planner faces: how much power must a specific site deliver, from the server rack to the grid connection?
Table of Contents
- What Data Center Power Requirements Mean
- Sizing the IT Load in MW and Kilowatts per Rack
- Rack Density and the Shift to High-Demand AI Cabinets
- Redundancy Tiers and Their Effect on Power Envelopes
- Cooling Power and How It Moves the PUE Number
- Utility Feeders, Substations, and Grid-Side Constraints
- Worked Power Profiles for Colocation, Hyperscale, and Edge
- Planning Headroom and a Practical Power Sizing Workflow
What Data Center Power Requirements Mean
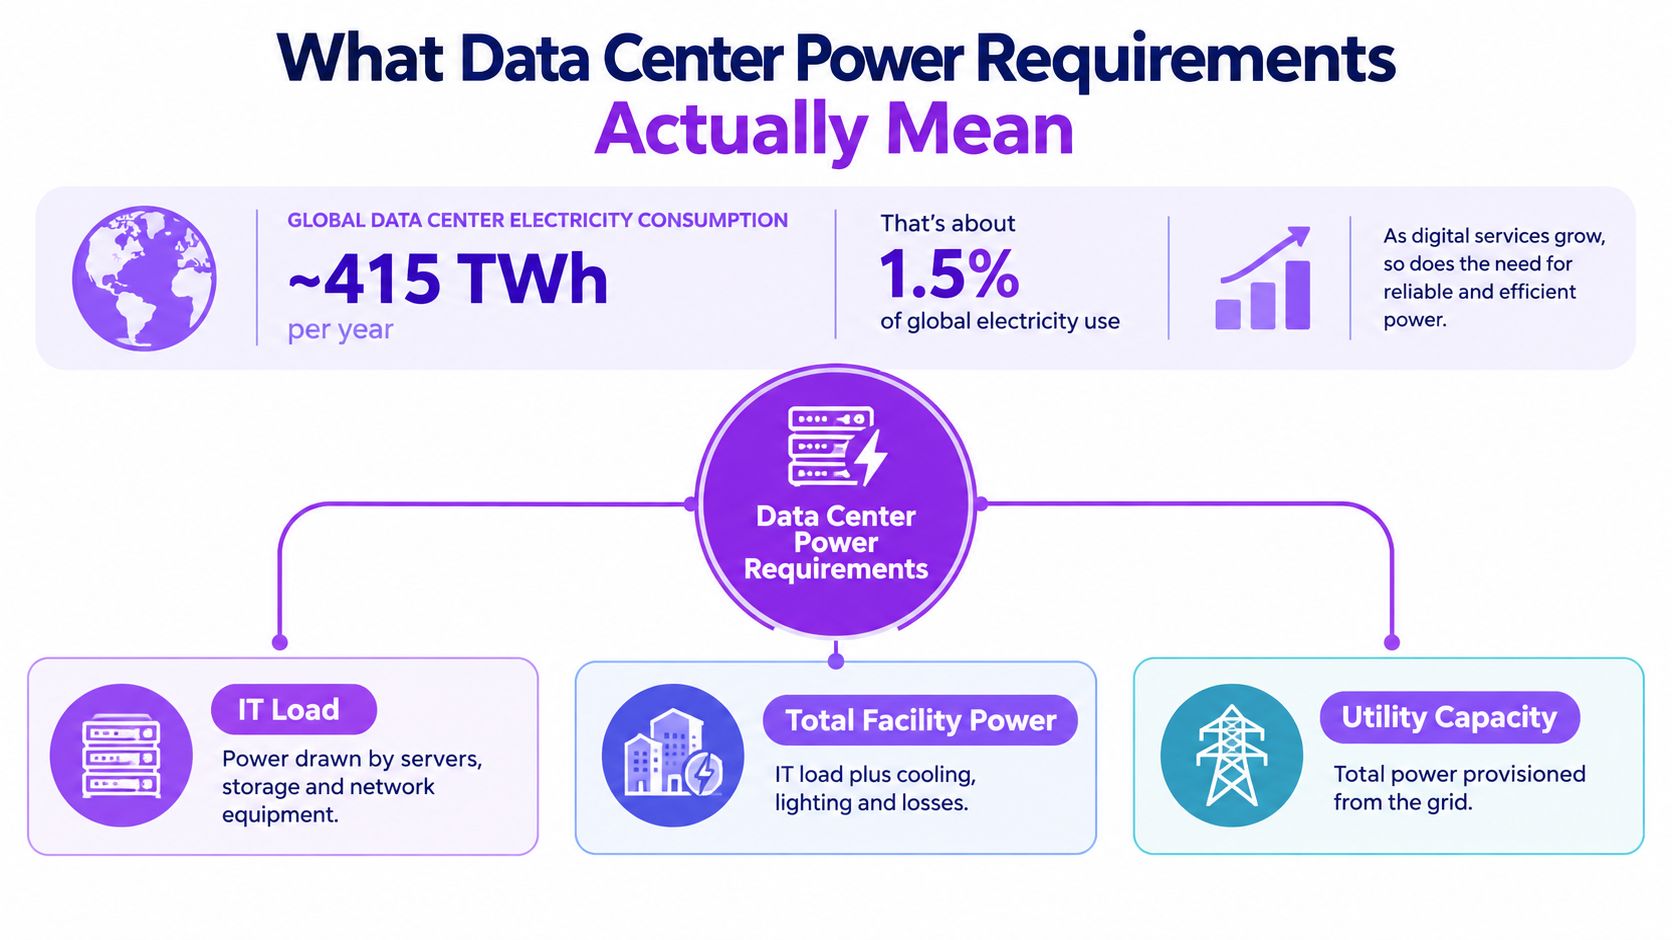
A project labeled 50 MW can require very different electrical infrastructure, depending on which layer the figure describes. Treating data center power as one number obscures the decisions involved in site selection, equipment procurement, permitting, and utility negotiations.
The three layers of demand
IT load is the electricity used by servers, storage, and network equipment in the white space. It describes the computing capacity a facility can support and is commonly stated as kilowatts per rack or megawatts of IT capacity.
Facility load combines IT consumption with cooling, lighting, pumps, power-conversion losses, and other building systems. Power Usage Effectiveness, or PUE, expresses that relationship:
Total facility power = IT equipment power × PUE
A 50 MW IT load at a 1.2 PUE requires 60 MW at the facility level. At a 1.8 PUE, the same IT capacity requires 90 MW. The PUE and data center power calculation reference illustrates why overhead affects utility capacity, UPS sizing, generators, and cooling plant requirements.
Utility feed capacity is the amount the electrical service, substation, transformers, switchgear, and feeders can physically deliver. It differs from the operating load because the utility envelope may include redundancy, maintenance conditions, staged construction, and future expansion.
Why the distinction changes decisions
A statement that “the project needs 50 MW” is incomplete. It may refer to 50 MW of IT equipment, 50 MW at the building meter, or 50 MW of contracted grid capacity. Each interpretation leads to different transformer counts, feeder requirements, backup systems, cooling designs, and land-use implications.
Use a layered calculation:
- Establish the target IT load.
- Apply the expected PUE to calculate facility demand.
- Add requirements for redundancy, phasing, and growth.
- Confirm that the utility can deliver the resulting envelope at the required voltage and schedule.
Keeping the layers separate makes the MW figure usable for colocation, hyperscale, and edge planning, rather than treating every facility profile as interchangeable.
Sizing the IT Load in MW and Kilowatts per Rack
IT capacity begins with the cabinet. A hall's total IT load is the combined demand of its racks, while rack density determines how that demand reaches electrical distribution and cooling equipment.
The basic conversion is:
IT load in MW = rack count × kW per rack ÷ 1,000
The industry reference on data center power density places typical rack density around 8 kW per rack and notes that newer AI cabinets can exceed 130 kW per rack. These values are reference points, not universal design targets. Rack count alone cannot define a project's electrical requirement.
The same MW can describe very different buildings
Each profile below reaches roughly the same IT capacity, but the building consequences differ.
| Facility Profile | Racks | kW per Rack | IT Load (MW) | Facility at PUE 1.2 (MW) | Facility at PUE 1.8 (MW) |
|---|---|---|---|---|---|
| Enterprise-style hall | 10,000 | 5 | 50 | 60 | 90 |
| Hyperscale-style hall | 2,000 | 25 | 50 | 60 | 90 |
| High-density AI hall | 400 | 130 | 52 | 62.4 | 93.6 |
The enterprise-style profile spreads demand across many lighter cabinets, increasing rack count and floor distribution requirements. The hyperscale-style profile uses fewer, heavier racks, which changes busway capacity, feeder layout, and cooling intensity. The AI profile exceeds the nominal target because 400 racks at 130 kW each equals 52 MW. That small difference can affect the requested utility envelope and construction phase.
PUE depends on the cooling design
PUE should be treated as a design assumption tied to operating conditions, not as a fixed property of the IT load. Air-cooled rooms, liquid-assisted systems, chilled-water plants, and free-cooling arrangements place different demands on fans, pumps, compressors, heat rejection, and controls. Climate also matters. A site with favorable outdoor conditions may reduce mechanical cooling hours, while a hotter climate can require more cooling equipment and longer periods of mechanical operation.
The PUE sizing formula and worked comparison provides the underlying method for translating IT demand into facility demand. The planning task is to select a credible PUE range for the intended climate, cooling architecture, utilization level, and operating season, then test the resulting facility load against the electrical design.
A MW figure remains incomplete until its layer is named: IT load, facility demand, or contracted grid capacity. Colocation planning must account for customer diversity and reserved capacity. Hyperscale planning usually focuses on phased blocks and sustained high utilization. Edge sites may have fewer racks but less room for redundant plant. The same IT MW therefore produces different distribution, cooling, and expansion requirements.
Rack Density and the Shift to High-Demand AI Cabinets
Rack density changes the electrical architecture, not only the floor area. A conventional enterprise rack in the 5 to 10 kW range can often use familiar air distribution and standard low-voltage equipment. An AI cabinet exceeding 130 kW per rack requires a different approach to current delivery, heat removal, and equipment placement.
The data center power-density guidance provides a useful reference range, but the cabinet rating alone does not define the facility requirement. AI deployments are driving higher-voltage distribution, including 415 V and emerging 800 V DC approaches, alongside stronger busways and liquid-assisted cooling. These choices affect the conversion equipment, protection scheme, maintenance procedures, and the usable capacity of each electrical path.
Distribution follows density
A rack's power demand determines current, conductor sizing, breaker selection, busway capacity, and voltage-drop management. At high density, more current must reach each cabinet, often requiring shorter feeder runs and larger distribution equipment. The resulting constraint may appear at the rack row or busway before it appears in the site's headline IT MW.
A high-density cabinet also creates a mechanical challenge. Air-cooled systems must move enough air through the rack and remove the resulting heat from the room. As cabinet demand rises, rear-door heat exchangers, direct-to-chip cold plates, or immersion systems may become necessary. Each option changes pump capacity, heat exchangers, controls, maintenance access, leak detection, water use, and heat rejection.
Floor area can stop being the limiting factor
Two buildings can support the same IT MW while containing very different cabinet counts. A low-density design may run out of floor space first. An AI-oriented design may retain white-space capacity while reaching limits in busway ampacity, transformer capacity, cooling distribution, or utility service.
The Hut 8 River Bend AI data center campus illustrates why site evaluation must go beyond floor area. Planners need to test whether the electrical path and cooling topology match the intended cabinet profile, including concentrated loads, equipment clearances, and future deployment phases.
A facility designed for light racks can become power-limited before it becomes space-limited.
Rack density should therefore appear in the initial power brief beside total IT load. That pairing exposes the systems most likely to constrain deployment and separates cabinet-level demand from the facility and grid capacity required to support it.
Redundancy Tiers and Their Effect on Power Envelopes
Redundancy applies primarily to the critical power path, not to the number of racks. An operator can maintain the same IT load while installing additional UPS modules, generators, switchboards, feeders, and transfer equipment to support maintenance or failure conditions.
For a 10 MW IT load, an N architecture provides one complete equipment path sized for the required critical capacity. N+1 adds one spare parallel module or string, so the site retains the required capacity after one component is unavailable. The IT ceiling doesn't automatically rise, but the installed equipment and maintenance options do.
Mirrored paths multiply infrastructure
A 2N design duplicates the critical path. Each path can support the required load independently, which increases UPS, generator, switchgear, transformer, and distribution requirements even though the served IT load remains 10 MW. A 2N+1 arrangement adds a further spare to the mirrored architecture.
The table below describes the architectural relationship rather than a universal procurement schedule. Actual utility envelopes depend on load diversity, generator operating philosophy, transformer configuration, and the boundary used for capacity reporting.
| Tier | Architecture | Equipment Multiplier | Concurrent Maintenance | Approx. Utility Envelope (10 MW IT) |
|---|---|---|---|---|
| N | One required path | One required set | Limited | About the facility demand needed for the load |
| N+1 | Required path plus one spare | One extra parallel module or string | Better | Similar operating demand, larger installed capacity |
| 2N | Two independent paths | Two complete critical paths | Strong | Larger electrical envelope and duplicated equipment |
| 2N+1 | Two paths plus an additional spare | Mirrored paths with extra reserve | Strongest of these options | Highest installed capacity and equipment reserve |
The DCA Pier DC Tier III facility profile provides a useful reference point for discussing maintainability-oriented design. Tier labels communicate availability intent, but they don't replace a one-line diagram or a detailed capacity study.
Contracted capacity needs a clear boundary
A common mistake is to count redundant equipment as though it were ordinary operating load, or to ignore it entirely. The correct approach identifies the capacity required at each boundary, including utility service, medium-voltage distribution, UPS output, generator plant, and rack-level delivery.
Redundancy can inflate transformer MVA, switchgear ratings, and physical plant requirements while leaving the customer-facing IT MW unchanged. That is why a power request should state both deliverable IT capacity and installed critical infrastructure capacity.
Cooling Power and How It Moves the PUE Number
Cooling separates IT load from facility load in many data center designs. Its electrical demand can include room fans, chilled-water and condenser-water pumps, cooling towers, compressors, controls, humidification, and other heat-rejection equipment.
A conventional air-handling system may assign a substantial share of facility demand to cooling, especially when outdoor conditions, humidity control, or high supply-air volumes increase runtime. Liquid cooling changes how heat moves, but cooling power remains. Pumps, heat exchangers, controls, and heat-rejection equipment still draw facility power.
The PUE comparison
For a 50 MW IT load, the standard relationship is:
Facility power = IT power × PUE
That produces materially different requirements:
- At PUE 1.4, facility demand is 70 MW.
- At PUE 1.2, facility demand is 60 MW.
- At PUE 1.15, facility demand is 57.5 MW.
The difference between the first and third cases is 12.5 MW of facility demand, while the IT load remains unchanged. That gap affects utility planning, electrical equipment, operating cost, and available expansion headroom.
| Subsystem | Conventional Air (PUE 1.4) | Economizer (PUE 1.2) | Liquid Cooled (PUE 1.15) |
|---|---|---|---|
| IT equipment | 50 MW | 50 MW | 50 MW |
| Cooling and heat rejection | Included in 20 MW overhead | Included in 10 MW overhead | Included in 7.5 MW overhead |
| Lighting, conversion losses, controls, and other overhead | Included in total overhead | Included in total overhead | Included in total overhead |
| Total facility power | 70 MW | 60 MW | 57.5 MW |
The table groups overhead rather than assigning unsupported percentages to individual subsystems. Actual measurements vary with climate, equipment selection, operating temperature, load profile, and the boundary used for PUE.
Cooling choices create electrical consequences
Outside-air economizers can reduce compressor operation when conditions permit. Liquid cooling can move heat closer to dense cabinets and support higher rack demand, but it adds pumping and heat-exchanger requirements. The Syracuse University green data center profile shows why cooling architecture belongs in early infrastructure planning, rather than being treated as a late mechanical package.
PUE also needs context. A colocation facility may operate mixed tenant densities, a hyperscale campus may optimize a repeatable cooling design, and an edge site may accept a different efficiency trade-off because of its smaller footprint and local conditions. The same IT MW therefore does not imply the same facility MW across deployment profiles.
Lighting, switchgear, power conversion, controls, and other systems continue to consume power even in an efficient design. A lower PUE reduces the facility requirement, but electrical planning still must account for the actual operating load, cooling configuration, and resilience model.
Utility Feeders, Substations, and Grid-Side Constraints
A facility's IT load is not the same as its grid requirement. Power must travel from the utility connection through the site substation, medium-voltage switchgear, feeders, transformers, UPS systems, and power distribution units before it reaches the rack. Each stage adds capacity limits, losses, protection requirements, or operating constraints.
The utility-side path
Planning should follow the electrical path:
- Transmission or distribution connection: The utility's voltage class and available network capacity establish the starting point.
- Site substation: Transformers convert incoming service to the voltages used across the campus.
- Medium-voltage switchgear: Bus ratings, protection settings, and interrupting capability determine safe operating limits.
- Feeders and branch distribution: Conductor ampacity, thermal derating, voltage drop, and routing govern delivery to each building.
- Low-voltage transformation and PDU equipment: These systems condition and distribute power inside the IT rooms.
A site may use distribution service around 12.47 kV, 25 kV, or a higher-voltage transmission connection. The appropriate choice depends on the utility and site design, not on a universal data center standard.
Nameplate capacity is not deliverable capacity
A transformer nameplate or feeder rating does not automatically equal firm site capacity. Engineers may reduce the usable figure for loading limits, ambient-temperature derating, maintenance states, fault-current results, and contingency requirements.
The difference matters most at campus scale. The International Energy Agency's executive summary on data-center electricity demand describes rapidly expanding data-center electricity demand concentrated in a limited number of markets. That concentration makes the local connection, substation, and transmission path more relevant than a regional supply figure alone. A campus can have sufficient land and a large stated IT target while still waiting for a utility upgrade.
Utility approval, substation construction, and interconnection studies can set the delivery schedule before the building shell or white space becomes the critical path.
Grid queues, curtailment provisions, transmission upgrades, and available substation space can constrain expansion more sharply than the site boundary. The power brief should therefore state the requested MW, voltage level, delivery date, service firmness, and treatment of on-site generation. It should separate normal operating demand from the maximum instantaneous requirement when synchronized workloads run together.
For colocation, contracted capacity and tenant diversity shape the utility request. Hyperscale projects must align feeder sections, substations, and later campus phases. Edge sites usually face a smaller but less flexible constraint, the host building's service entrance and local distribution equipment. A single MW figure hides these differences. The interconnection design determines whether that figure is usable.
Worked Power Profiles for Colocation, Hyperscale, and Edge
The same MW headline represents different engineering problems by facility type. Colocation centers on tenant diversity and contracted service. Hyperscale projects depend on campus delivery and expansion phases. Edge nodes are limited by the host building, local service, and heat rejection.
| Parameter | 5 MW Colocation Hall | 100 MW Hyperscale Campus | 200 kW Edge Node |
|---|---|---|---|
| Stated IT load | 5 MW | 100 MW | 0.2 MW |
| Facility demand | IT load multiplied by selected PUE | IT load multiplied by selected PUE | IT load multiplied by selected PUE |
| Rack profile | Mixed tenant densities | Repeated high-density halls, potentially including AI cabinets | Limited cabinet count and localized demand |
| Critical power focus | N+1 UPS and generator configuration | Multiple paths, substations, and feeder sections | Service entrance, UPS, and battery runtime |
| Dominant constraint | Diversity assumptions and contracted capacity | Grid delivery, transformer capacity, and phasing | Host-building service and heat rejection |
| Expansion question | Can another tenant phase use the reserved feeder capacity? | Can the substation and utility connection support later halls? | Can the building absorb additional heat and electrical load? |
Colocation
A 5 MW colocation hall may serve customers with different utilization patterns, cabinet densities, and growth schedules. The operator needs a firm IT capacity commitment, then must add facility overhead, UPS architecture, generator strategy, and the diversity assumptions behind tenant demand.
The main exposure is an unqualified diversity factor. If several tenants can activate dense cabinets at the same time, the electrical and cooling design needs a documented path to that combined load. Contracted capacity may describe the commercial commitment, while the service entrance and mechanical plant must handle the operating condition that the commitment permits.
Hyperscale
A 100 MW hyperscale campus shifts much of the risk beyond the building. Substation transformer count, medium-voltage feeder ampacity, protection coordination, equipment space, and utility construction schedules determine whether the stated IT target can be delivered in sequence.
AI halls also change the distribution problem. Cabinets can reach very high densities, including levels above 130 kW per rack. A campus may therefore have enough aggregate MW on paper while lacking the busways, feeder topology, liquid-cooling capacity, or heat-rejection equipment needed to place that power in the intended halls. The usable figure is the portion supported by all of those systems, not the grid request alone.
Edge
A 200 kW edge node can be modest in aggregate and still difficult to deploy. One service connection, limited battery capacity, local transformer headroom, and the host building's ability to reject heat may define the design.
The relevant check is site-specific. Regional generation capacity does not confirm that the building can accept, condition, back up, and dissipate the requested load. For an edge node, the facility demand multiplier and local equipment may matter more than the nominal IT figure, while expansion can require a new service rather than a larger equipment schedule.
Planning Headroom and a Practical Power Sizing Workflow
A usable power requirement is a forecast, not a reading from today's equipment schedule. Developers need headroom for workload changes, higher rack density, cooling transitions, redundancy choices, and utility limits. The planning figure should keep IT load, facility demand, and grid-deliverable capacity separate.
Start with a defensible IT target
Define the intended IT load in MW, then support it with a rack-density profile. A large aggregate target built from conventional cabinets requires a different electrical layout from a smaller deployment containing AI cabinets above 130 kW per rack, as noted earlier.
Apply a PUE assumption after establishing the IT target. A 50 MW IT load at a 1.25 PUE requires 62.5 MW of facility power. At a 1.45 PUE, the same IT load requires 72.5 MW. These figures show why an IT commitment cannot stand in for the facility or utility requirement.
Add the constraints behind the headline number
A practical workflow should include:
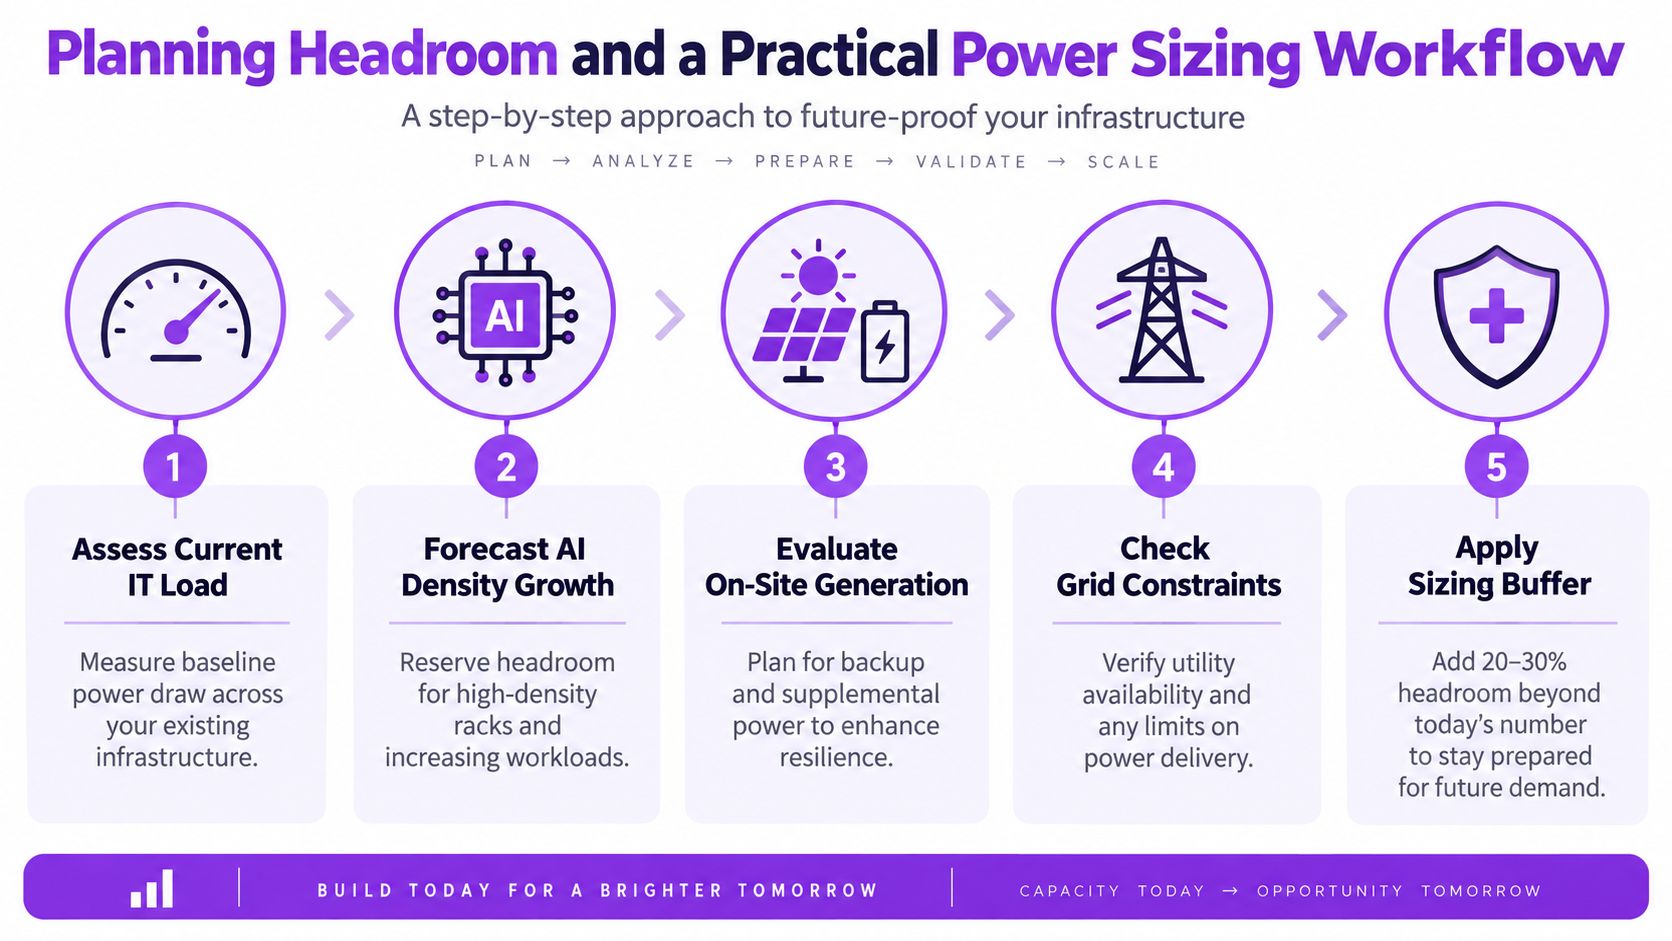
- Measure the current IT baseline. Separate server, storage, and network demand from mechanical and electrical overhead.
- Model future rack density. Test whether planned AI cabinets require new busways, feeders, liquid cooling, or additional heat rejection.
- Select the redundancy architecture. Size UPS, generators, switchgear, and feeders for N, N+1, 2N, or 2N+1. Redundancy affects the electrical envelope, not only the rack count.
- Verify utility deliverability. Confirm voltage class, transformer capacity, feeder ampacity, protection requirements, interconnection timing, and curtailment conditions.
- Reserve expansion capacity. A project may carry a 20% to 30% headroom reserve, but the buffer should correspond to a stated growth scenario rather than an unexplained multiplier.
Use a checklist before approving the MW figure
The final review should confirm:
- IT load target: Does the figure represent server-side capacity, critical facility demand, or utility demand?
- PUE assumption: Does it match the proposed cooling and electrical architecture?
- Rack density: Can distribution and cooling support the intended cabinet mix?
- Redundancy tier: Are critical paths and maintenance conditions explicit?
- Feeder ampacity: Do voltage drop, thermal derating, and protection studies support the requested load?
- Expansion reserve: Can the site support the next deployment phase without rebuilding its electrical backbone?
The IEA's 2025 update on data-center electricity use reports that AI-focused demand is growing faster than overall data-center demand and is projected to triple by 2030. That trend makes the separation between IT MW, facility MW, and grid-deliverable MW a planning requirement. A MW figure is only usable when the site can distribute, cool, back up, and obtain it.
Data Centers List helps developers, operators, and analysts compare facilities by location, status, operator, and disclosed or AI-estimated IT power capacity, including planned and under-construction sites. Visit Data Centers List to map regional capacity, examine pipeline projects, and test how market-level power availability affects site planning.