Data Center Knowledge: Essential Metrics and Market Insights
Build your data center knowledge with this guide covering key metrics like PUE and IT MW, essential terminology, and global market insights.
14 min read
The U.S. data center sector already consumes about 176 terawatt-hours of electricity a year, roughly 4.4% of total U.S. electricity consumption in 2023 according to Congressional Research Service coverage of Lawrence Berkeley National Laboratory research. That single number changes the frame: data center knowledge is no longer niche technical trivia, it's basic infrastructure literacy for anyone involved in power planning, site selection, operations, or investment.
What matters most is not just that the sector is large, but that it is uneven. Efficiency has improved, yet demand keeps rising, and the market's real operating reality sits in the middle, not at the extreme ends. A serious working model has to account for power draw, cooling behavior, facility type, geography, grid constraints, and community impact, because each of those affects cost, risk, and delivery timelines in different ways.
Table of Contents
- Why Data Center Knowledge Matters More Than Ever
- Core Power and Efficiency Metrics Explained
- The Missing Middle of the Data Center Market
- Essential Data Center Terminology and Classifications
- Global Facility Distribution and Market Geography
- Operational Standards and Best Practices
- Community Impact and Local Considerations
- Facility Evaluation Checklist for Practitioners
- Building Your Data Center Knowledge Base
Why Data Center Knowledge Matters More Than Ever
The sector is large enough that its operating choices now affect power systems, permitting, and local planning at the same time. In the U.S., data centers already consume a meaningful share of national electricity, so decisions about siting, redundancy, cooling, and utility interconnection cannot be treated as isolated facility questions as summarized in Congressional Research Service coverage of Lawrence Berkeley National Laboratory research. Once an asset class reaches that level of demand, fluency in power, capacity, and efficiency becomes part of core infrastructure literacy.
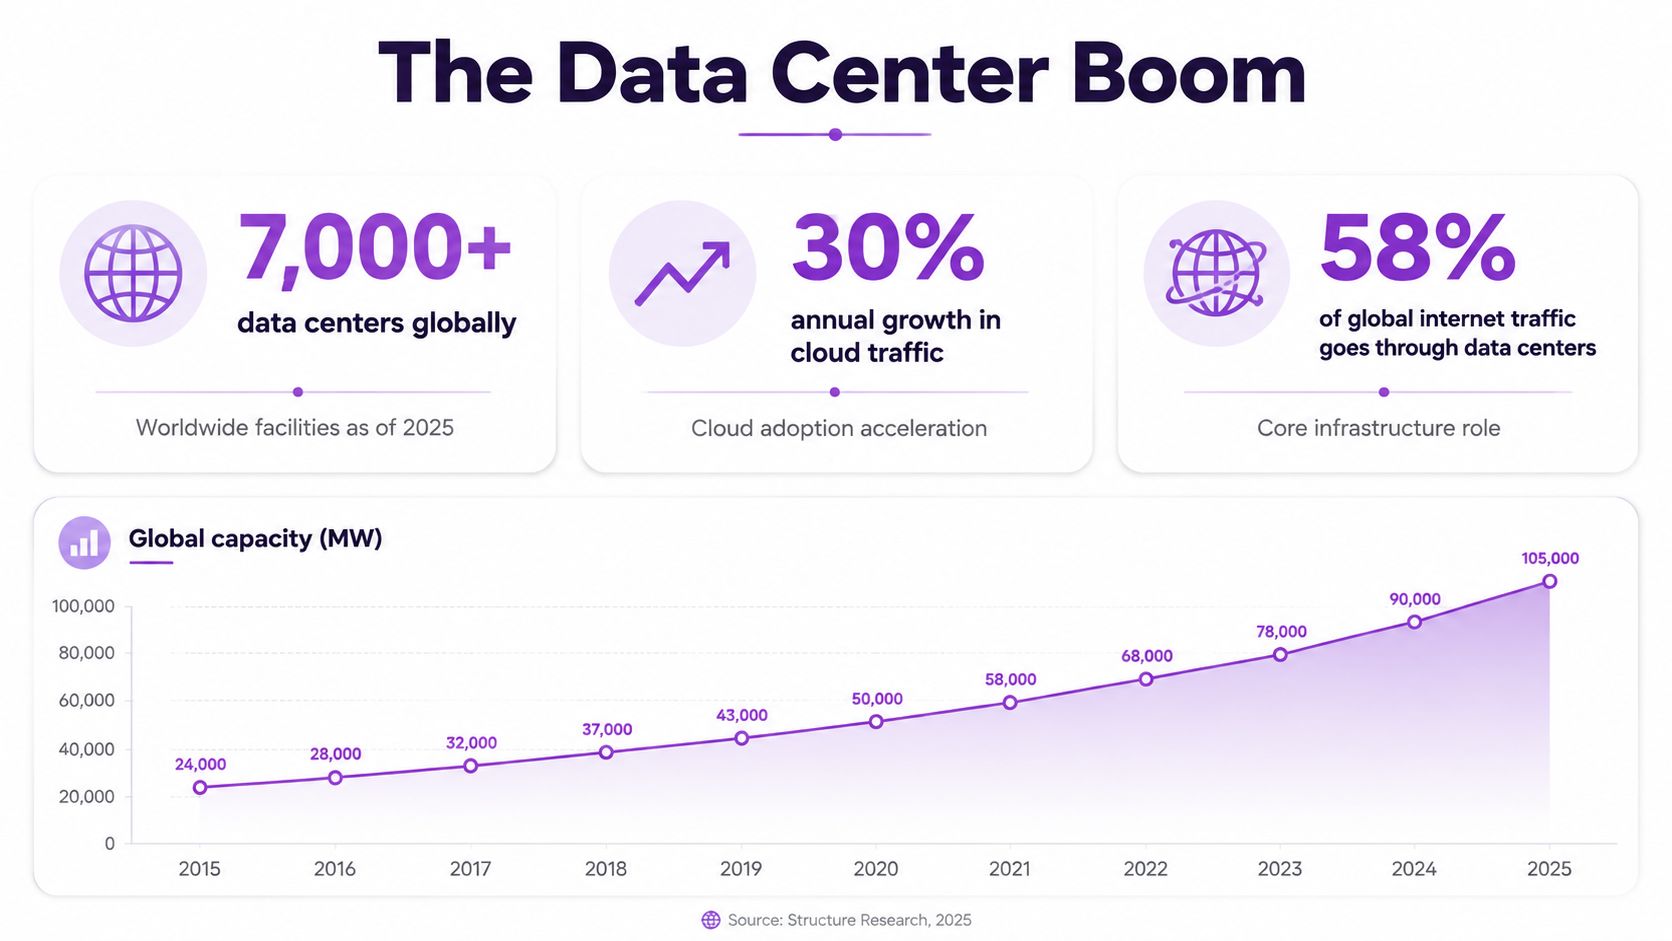
The decision stack behind every facility
Data center knowledge works as a decision stack. Power sits at the base, followed by efficiency, location, operations, and community impact. If one layer is weak, the project becomes harder to finance, harder to permit, or harder to operate.
Practical rule: a site that looks inexpensive on land can still be a poor choice if the utility path, cooling design, or permitting environment adds friction later.
Cross-functional teams need the same baseline vocabulary because each group evaluates the facility from a different angle. Engineers focus on load paths and cooling performance, finance teams look at capital intensity and operating stability, legal teams review contracts and local rules, and procurement teams need claims that can be verified before a deal is signed. A facility profile only becomes useful when all of those groups can interpret it the same way.
The biggest gap in market coverage sits in the middle. Hyperscale campuses get most of the attention, yet the 3 to 25 MW facilities that carry most non-AI workloads are the assets operators, utilities, and buyers deal with every day. That missing middle is where practical knowledge matters most, because it determines whether capacity is usable, whether a market can absorb new load without strain, and whether a project can move from paper to operation without avoidable tradeoffs.
Core Power and Efficiency Metrics Explained
A facility's power profile is easy to misunderstand at first glance. IT power is the electricity available to servers and other computing equipment, while total facility power includes the extra energy needed to keep that equipment running within acceptable operating conditions. That gap matters because two sites can support the same IT load and still produce very different operating costs if one spends more on cooling, power conversion, or airflow management.
What each metric tells the buyer
PUE, or power usage effectiveness, is the most common efficiency ratio. Lower values indicate that a larger share of incoming power reaches the IT load instead of being consumed by overhead. Industry research summarized by the Congressional Research Service notes that average PUE improved from 1.6 in 2015 to 1.3 in 2023, and the best-performing facilities now achieve PUE below 1.1. That trend is meaningful, but it has not offset broader sector growth.
WUE, or water usage effectiveness, answers a different question. It measures how much water a site uses to support cooling, so it belongs in any assessment where water stress, permitting, or local community pressure could affect operations. A site can look efficient on electricity and still create serious tension if its cooling approach depends heavily on local water conditions.
| Metric | Definition | Formula or Calculation | Industry Benchmark |
|---|---|---|---|
| IT Power | Electricity available to computing equipment | Load allocated to servers and related IT gear | Higher is not automatically better, because design fit matters |
| Total Facility Power | All electricity entering the site | IT power plus cooling, lighting, UPS losses, and other overhead | Must be compared carefully across sites |
| PUE | Efficiency ratio for overhead energy | Total facility power divided by IT power | Lower is better, with top sites below 1.1 |
| WUE | Water used for cooling efficiency | Water used divided by IT energy load or annual IT energy | Best interpreted alongside local water conditions |
The practical takeaway is straightforward. Buyers should not ask only how much capacity a site has. They should ask how much of that capacity is usable, how efficiently it is delivered, and what hidden resource costs sit behind the number.
The Missing Middle of the Data Center Market
Most public attention goes to hyperscale campuses, but that lens misses the operating center of the market. Mid-sized facilities in the 3 to 25 MW range account for 86% of global non-AI workloads according to one recent industry analysis. That is the part of the market where banking platforms, healthcare systems, enterprise workloads, and regional cloud connectivity live.
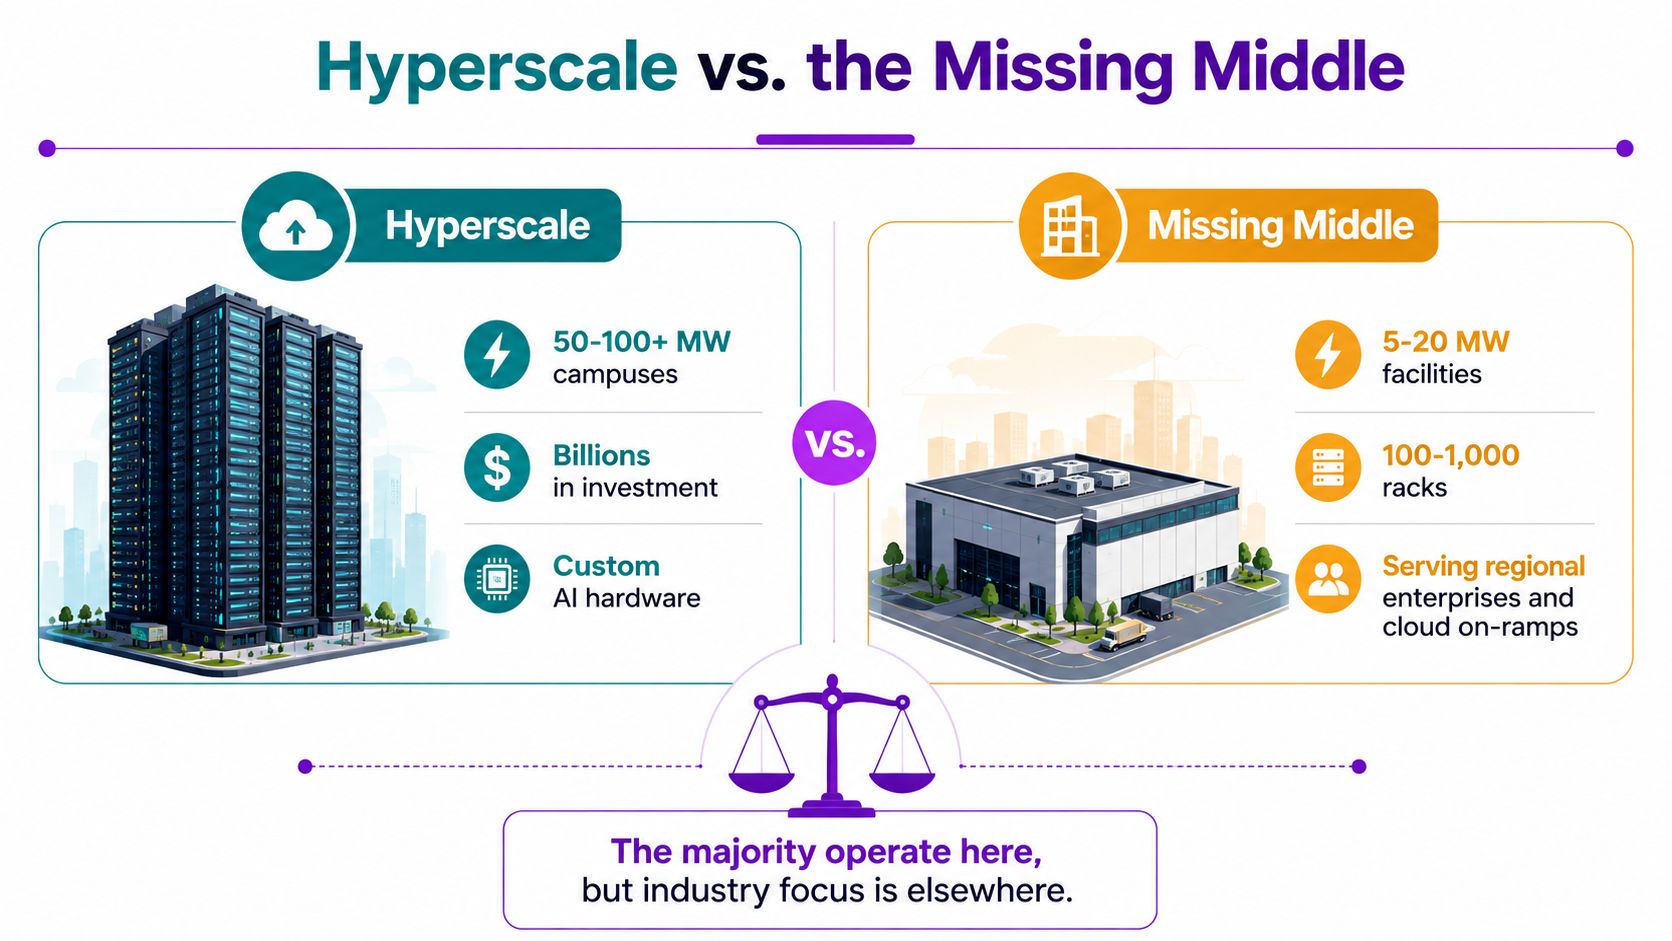
Why the middle is commercially important
These sites are often the hardest to talk about because they are neither tiny server rooms nor headline-grabbing megacampuses. They need enough power to matter, but not so much that they dominate a regional grid narrative. They need serious connectivity, but they rarely receive the same media attention as hyperscale expansion projects.
The market's most common operational problem is not futuristic AI scale, it's ordinary capacity delivered reliably in the middle range.
That has direct consequences for decision-making. Buyers need better siting discipline because the middle market is where utility access, land availability, and latency tradeoffs become real constraints rather than theoretical ones. Operators need better lifecycle planning because many of these sites were built for a different era of workload density. Analysts need better visibility because a market can look “mature” on paper while still hiding gaps in the exact segment that carries the bulk of non-AI demand.
The implication is uncomfortable but useful. If a team only studies hyperscale behavior, it will overfit its assumptions. The missing middle is where many practical sourcing decisions happen, and where incomplete knowledge creates the most expensive mistakes.
Essential Data Center Terminology and Classifications
Facility terminology is not just jargon, it is a map of how risk and responsibility are divided. Colocation usually means multi-tenant shared space, hyperscale usually means large single-owner environments, enterprise points to corporate-owned infrastructure, and edge refers to distributed small-footprint sites. Those labels matter because the economics, operational control, and expansion paths are very different.
How classification changes the way a site is judged
Tier language also shapes expectations. Tier I implies a single path, Tier II adds redundant components, Tier III introduces multiple paths, and Tier IV is built around fault tolerance. The point is not to memorize labels for their own sake, but to understand what level of resilience a buyer is paying for.
| Facility Type | What it usually means | When it matters most |
|---|---|---|
| Colocation | Multi-tenant shared space | Interconnection, flexibility, and mixed workloads |
| Hyperscale | Single-owner massive scale | Large cloud and platform deployments |
| Enterprise | Corporate on-premise environment | Legacy apps, governance-heavy workloads |
| Edge | Distributed small footprint | Low-latency or localized processing |
One practical habit helps reduce confusion. When reviewing a facility profile, separate status from type. A planned colocation site, an active enterprise facility, and an under-construction hyperscale campus may all sit in the same metro area, but they are not comparable on risk, timing, or commercial readiness.
For teams that need a working glossary rather than guesswork, a standardized reference like the Data Centers List terms page can help align vocabulary before procurement, diligence, or market mapping starts. That matters because a lot of bad analysis comes from using the same word to mean three different things.
Global Facility Distribution and Market Geography
The global footprint is already broad. There are more than 11,700 operational data centers worldwide, and the United States alone accounts for 5,427 sites, or about 46% of the global total according to industry compilation data. By the end of 2025, hyperscale operators reportedly controlled 48% of global capacity, which shows how quickly ownership and capacity concentration have shifted.
What geography reveals that a headline cannot
Location is not a cosmetic detail. It affects latency, power availability, network access, regulatory exposure, and community response. That is why market analysis has to distinguish between a place that merely has data centers and a place that can still absorb additional load without major bottlenecks.
A directory with map and filter functions becomes valuable here because it lets analysts compare markets by status, capacity, and operator concentration instead of relying on anecdotes. The global facility map is useful for that kind of benchmark work because it surfaces active, planned, and under-construction sites in the same view.
The strongest geographic insight is this. Mature markets tend to combine dense interconnection and strong demand, but they also face tighter power and land constraints. Emerging markets may look more flexible, but they often require deeper diligence on utility readiness, permitting, and long-term absorption. Geography is therefore not just where a facility sits, it is a proxy for how easily the next megawatt can be delivered.
Operational Standards and Best Practices
Operational quality starts with airflow discipline. Hot-aisle and cold-aisle separation reduces the mixing of supply and return air, and containment makes that separation more effective. U.S. DOE/FEMP best-practice guidance also recommends device-level power metering and real-time DCIM monitoring so operators can see load distribution instead of guessing at it in Berkeley Lab's DCOI best-practices material.
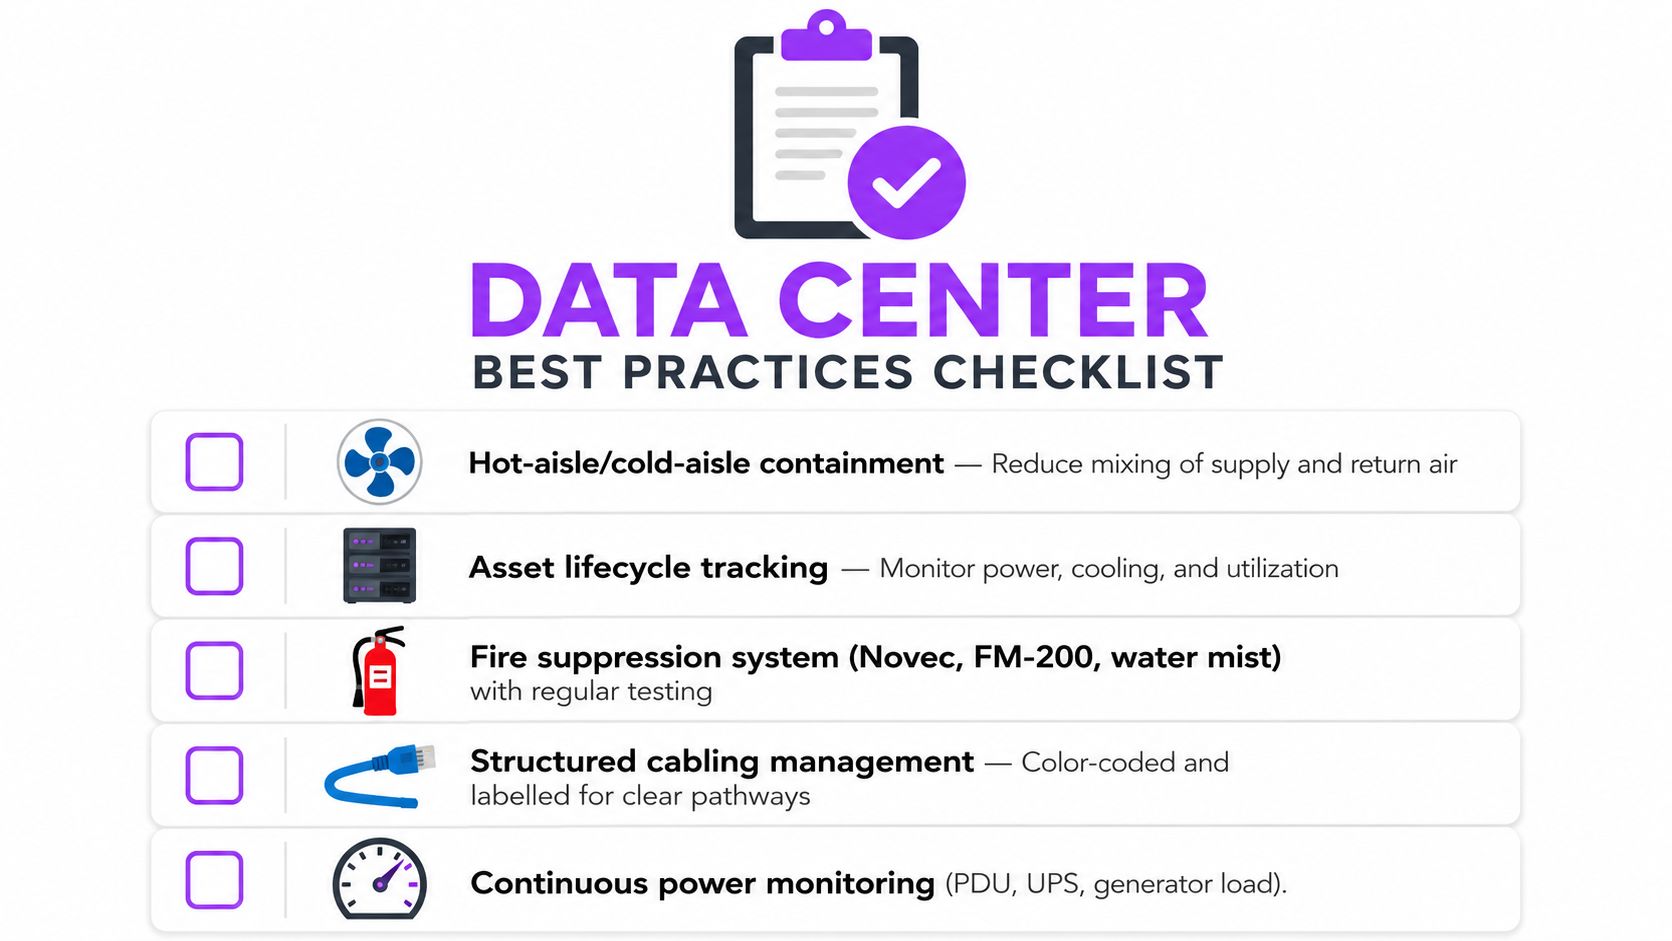
Standards that turn intent into repeatable practice
The broader standards picture matters too. ISO/IEC 22237 and the EU Code of Conduct emphasize formal asset management for IT and M&E infrastructure, and the EU guidance explicitly cites ISO 55000 as a framework for controlled lifecycle management across the data center lifecycle in the European best-practice document. That is a sign that professional operations are increasingly managed as systems, not as collections of disconnected equipment.
Operational takeaway: if a facility can't measure load, it can't manage it well.
The DOE/FEMP guidance also sets target PUE of 1.5 or below overall and 1.4 or below for new data centers in the same Berkeley Lab material. Those targets are not a guarantee of performance, but they give buyers a benchmark for what disciplined operations should try to achieve.
The best practice pattern is consistent. Measure at the device level, contain airflow, monitor in real time, and manage assets through a lifecycle framework. If those four habits are absent, the site may still operate, but it will be much harder to trust its numbers.
Community Impact and Local Considerations
Data centers are local infrastructure as much as they are digital infrastructure. Independent research warns that the AI and data center boom can push costs onto taxpayers and utility customers when new load forces grid upgrades or rate changes, while communities are already feeling pressure on water demand, noise, and local infrastructure according to a recent policy analysis. That is no longer a side issue, it is part of site risk.
What local diligence needs to ask
A serious community review starts with the utility map. If a project requires major upgrades, the question is who pays and how those costs are recovered. It then moves to water, because cooling choices can become contentious quickly in places where residents already see tight supply conditions.
Noise and traffic matter too, especially during construction and commissioning phases. So do substation siting, fiber routes, and the visual footprint of backup generation. These are not abstract concerns, they are the concrete issues that shape local opposition or acceptance.
A strong analyst treats community impact as a distribution question. Who captures the upside, who absorbs the burden, and what remains after the ribbon is cut? That framing is more useful than broad claims about development benefits because it forces teams to assess whether a project is resilient socially as well as technically.
Facility Evaluation Checklist for Practitioners
A good site review starts with power and ends with consequences. Buyers should ask whether the facility's IT MW aligns with the workload, whether the PUE is credible for the cooling design, and whether redundancy is documented rather than assumed. If the answer is vague, the risk usually sits in the operating model, not just the brochure.
Questions that separate solid sites from weak ones
- Power Path Clarity: Is the load path documented from utility feed to UPS to rack, and are the failure modes clear?
- Cooling Fit: Does the site's airflow design match the workload density, or is it being stretched beyond its original intent?
- Connectivity Depth: Are carrier options and cross-connects available in a way that supports current and future demand?
- Operational Visibility: Can the operator show live metering, monitoring, and maintenance records without hesitation?
- Location Exposure: Does the market face water, grid, or permitting constraints that could change the economics later?
- Commercial Flexibility: Can the contract support expansion, relocation, or phased growth without locking the buyer into a mismatch?
A site that answers technical questions quickly but dodges commercial ones usually has unresolved risk somewhere in the deal structure.
One practical discipline helps across all buyer types. Ask for evidence that is current, facility-specific, and internally consistent. A good operator can explain why a number is disclosed, estimated, or conditional. That transparency matters because a facility with strong engineering but weak documentation can still become a procurement problem.
For researchers, investors, and site selectors, the right workflow is to compare facilities on the same dimensions every time. Capacity, status, utility access, cooling approach, and local context should all sit in the same evaluation grid, or the comparison will be more narrative than analytical.
Building Your Data Center Knowledge Base
The fastest way to build durable expertise is to separate the field into five learning lanes, then keep each one current. Those lanes are metrics, terminology, market geography, operations, and community impact. Each one has its own source type, and treating them separately prevents bad synthesis from creeping into planning conversations.
A practical learning framework
- Metrics: Track capacity, PUE, and resource intensity first, because those numbers shape every downstream decision.
- Terminology: Use standardized facility labels so internal teams don't argue over words before they analyze the asset.
- Geography: Watch market distribution and pipeline visibility so planning reflects where capacity exists.
- Operations: Keep standards and lifecycle practices current, because a site's design intent can drift over time.
- Community impact: Review power, water, noise, and infrastructure context before a site is presented as low-risk.
For ongoing market intelligence, a directory that combines facility-level profiles, status labels, and map views is useful because it ties abstract knowledge to real assets. Data Centers List fits that need by organizing operational, planned, and under-construction sites in one place, which helps turn scattered facts into a working market view.
The broader lesson is that this industry rewards structured curiosity. Teams that revisit the same few metrics, labels, and market questions on a regular basis make better decisions than teams that only react when a project is already in trouble.
If the goal is to evaluate markets, compare facility types, or understand how local conditions shape capacity, a structured directory is the right place to start. Visit Data Centers List to review facility profiles, market context, and pipeline visibility, then use that baseline to make sharper decisions about site selection, operations, and community impact.