Data Center Environmental Impact Explained
Explore data center environmental impact across energy, water, emissions, land, noise, measurement, and mitigation with practical examples.
19 min read
A site-selection team can approve two apparently identical campuses and still approve two very different environmental outcomes. The server halls may have the same capacity, the same cooling design, and the same efficiency score, yet one site may draw electricity from a carbon-intensive grid while competing for water in a stressed basin. The other may operate in a cooler climate with a lower-carbon electricity mix and more resilient water supplies.
That difference is the central problem in assessing data center environmental impact. A facility isn't an isolated building with a portable footprint. It is a workload connected to equipment, equipment connected to a facility, and a facility connected to a particular electricity system and watershed. Operators, developers, investors, and local stakeholders need to trace all three connections before treating an efficiency claim as evidence of lower total impact.
Table of Contents
- Why Data Center Impact Changes by Location
- How Environmental Impact Moves Through the System
- Energy Carbon Water Land and Noise Effects
- Metrics That Make Environmental Impact Measurable
- Mitigation Strategies and Their Trade-Offs
- Regional Scenarios and Capacity Pipelines
- Disclosure Rules and the Rebound Challenge
- A Practical Environmental Assessment Checklist
Why Data Center Impact Changes by Location
Consider two identical 100 MW campuses placed on opposite sides of a continent. Both have the same server count, the same floor area, and the same Power Usage Effectiveness, or PUE. One sits beside a water-stressed basin and draws incremental electricity from a coal-heavy grid. The other is located in a cooler, hydro-rich region with abundant land and less constrained water availability.
The buildings are identical. Their environmental profiles aren't.
The first campus can create higher operational carbon emissions because the electricity required at the margin may come from carbon-intensive generation. Its cooling system can also face greater pressure during hot periods, while local withdrawals compete with agriculture, households, ecosystems, or industrial users. The second campus may still consume substantial electricity and occupy significant land, but its carbon and direct cooling profile can differ because the surrounding systems differ.
The International Energy Agency's analysis of energy demand from AI estimates that data centers consumed about 415 TWh of electricity worldwide in 2024, roughly 1.5% of global electricity use. The IEA also says consumption grew by about 12% per year over the previous five years and projects global data center electricity demand to more than double to around 945 TWh by 2030, just under 3% of total global electricity demand. At that scale, location affects not only a project's footprint, but also grid planning and regional infrastructure decisions.
Three variables that change the assessment
Grid carbon intensity determines the emissions associated with each unit of electricity, but the relevant figure isn't always the annual average. A new campus can trigger generation, imports, storage dispatch, or transmission upgrades at particular hours. The local marginal supply therefore matters alongside the marketed electricity product.
Water stress determines whether a cooling withdrawal is a manageable industrial demand or a politically and ecologically sensitive addition to an already strained basin. Ceres projects that annual water use associated with data center electricity consumption could rise from 2.9 billion gallons to more than 14.5 billion gallons, while water tied directly to cooling could increase from 385 million gallons to over 3.7 billion gallons. Those projections appear in Ceres' assessment of regional water stress, which also warns that growth could increase water stress in already strained basins by up to 17% annually, with larger seasonal peaks.
Ambient conditions influence cooling demand, equipment performance, and the feasibility of free cooling or higher-temperature operation. A cold climate can reduce mechanical cooling requirements, but it doesn't automatically resolve grid congestion, construction impacts, backup generation, or watershed concerns.
A Nordic site profile, such as the context illustrated by Reykjavik's data center market, can therefore differ sharply from a desert site even before the first server is installed. Site analysis should treat the facility as a node inside a grid and watershed, not as a standardized object that produces the same impact wherever it is built.
How Environmental Impact Moves Through the System
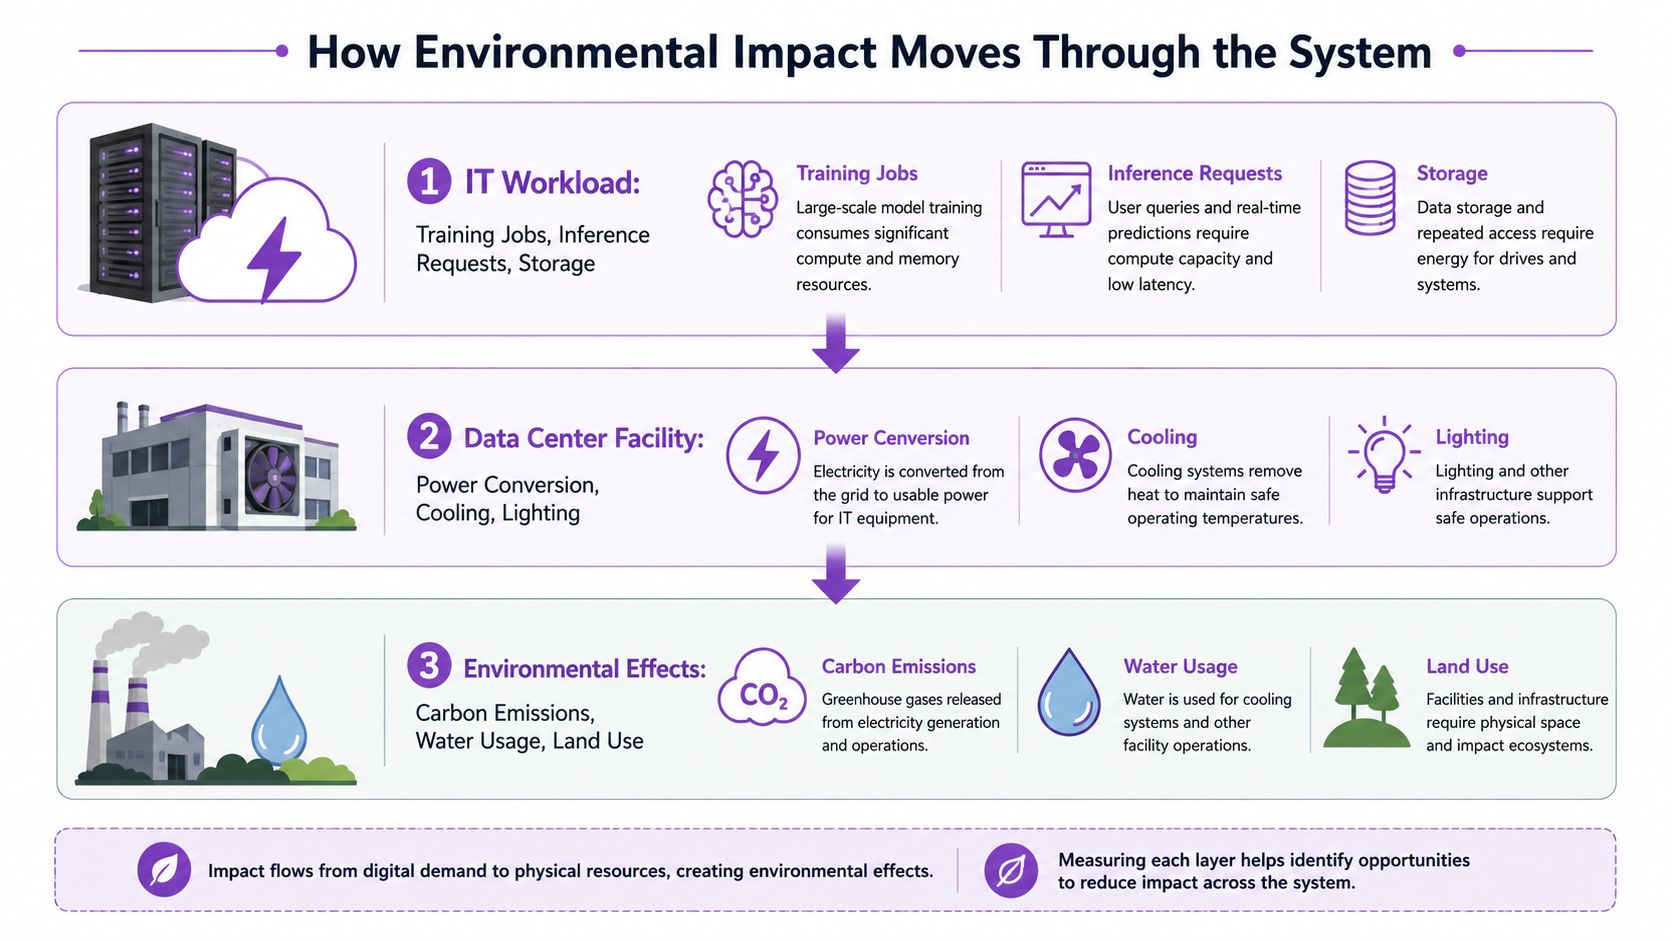
The cleanest mental model uses three connected layers. Demand begins with the IT workload, passes through the facility, and ultimately reaches the electricity and watershed systems that supply it.
Layer one is the workload
The first layer is the work being performed. Training jobs consume compute while models are built or updated. Inference requests consume compute when users or applications receive outputs. Storage reads, data movement, networking, and redundancy add demand around those primary tasks.
Workload efficiency depends on software design, hardware selection, utilization, and scheduling. A lightly utilized server still requires supporting infrastructure, so improving utilization can reduce the amount of equipment needed for a given service level. Hardware with lower power demand for the same task can reduce operational electricity use, although manufacturing and replacement cycles introduce their own embodied impacts.
The important question isn't only how much computing capacity a campus contains. It is how much useful service the capacity delivers, at what power demand, and during which hours.
Layer two is the facility
The second layer converts electricity into reliable computing conditions. Power distribution, conversion equipment, cooling, lighting, security, monitoring, and backup systems all sit between the workload and the outside environment.
Cooling is especially important because nearly all electricity used by IT equipment eventually becomes heat that must be managed. Air cooling, adiabatic systems, chilled-water designs, and liquid cooling shift the balance between electricity, water, equipment complexity, and retrofit difficulty. Backup generators may operate infrequently, but their fuel storage, testing, emissions controls, and noise still belong in the facility assessment.
Facility efficiency can reduce overhead, but it can't eliminate the workload that caused the demand. A better cooling design lowers the energy required around the IT load. It doesn't make a rapidly expanding compute fleet environmentally neutral.
Practical rule: A facility metric describes the conversion layer. It doesn't describe the entire service, grid, or watershed.
Layer three is the supplying system
The third layer includes the generators, transmission network, river, aquifer, and municipal utility that make operation possible. Electricity generation can create upstream emissions and water consumption even when the data center itself uses a water-efficient cooling system. Conversely, a facility with higher direct water use may have a lower total water footprint if its electricity supply is less water-intensive.
This nested-pipe model explains why mitigation at one layer can leave another layer stressed. Better server utilization may reduce electricity demand, but a constrained transmission corridor can still delay new capacity. Closed-loop cooling may reduce onsite withdrawals, while a water-intensive power mix continues to dominate upstream water consumption. Renewable procurement may lower reported market-based emissions without changing local hourly dispatch unless the procurement adds or matches supply effectively.
The assessment must therefore follow the flow from task to chip, chip to facility, facility to grid and watershed. Stopping at the building boundary produces a partial answer.
Energy Carbon Water Land and Noise Effects
A data center's environmental profile contains several impact categories, and each category has a direct facility component and an upstream system component. Treating them as interchangeable creates bad decisions.
Energy begins with the IT load. Power conversion and cooling add facility overhead, while construction adds embodied emissions from materials, equipment, and site development. The IEA estimates that the United States accounted for 45% of global data center electricity consumption in 2024, followed by China at 25% and Europe at 15%, as reported in its data center electricity consumption analysis. These regional shares matter because the same megawatt-hour can have a different emissions and water profile depending on the generation mix and operating conditions of the grid.
Water requires an even sharper distinction. Onsite consumption may result from evaporation in cooling towers or adiabatic systems, while withdrawal includes water taken from a source even when part of it returns. Electricity generation adds indirect water use. A water-efficient facility can therefore retain a substantial total water footprint if its electricity comes from water-intensive generation.
The IEA reports that U.S. data centers directly consumed about 66 billion liters of water in 2023, while their electricity use implied roughly 800 billion liters of additional indirect water consumption through power generation. That comparison appears in the IEA's analysis of data center electricity and household-equivalent consumption. The result changes the mitigation priority. Cooling architecture matters, but grid water intensity can matter more.
Land impacts extend beyond the fenced campus. The site can replace agricultural, ecological, or previously developed land. New transmission lines, substations, roads, and generation assets can expand the footprint further. Onsite renewable generation may reduce grid dependence but can increase land requirements, depending on the design and local conditions.
Noise is more localized. Fans, chillers, pumps, transformers, construction activity, and backup generators can affect nearby residents and sensitive ecological areas. A low-carbon grid doesn't remove that nuisance, and a quiet facility doesn't eliminate upstream impacts from generation or transmission.
| Impact Category | Direct Facility Effect | Upstream Grid or Watershed Effect |
|---|---|---|
| Energy | IT load, cooling, power conversion, lighting, and backup systems | Generation, transmission losses, and network reinforcement |
| Carbon | Construction materials, fuel combustion, and operational electricity | Marginal generation emissions and upstream supply chains |
| Water | Cooling, humidification, treatment, and discharge | Water used by power generation and fuel supply |
| Land | Campus, roads, substations, and buffers | Transmission corridors and new generation sites |
| Noise | Fans, chillers, pumps, transformers, and generators | Construction and infrastructure activity beyond the site |
Trade-offs connect these categories. A dry cooling design can reduce direct water use but increase electricity demand. A higher-carbon grid can intensify pressure to procure clean power, while certain low-carbon generation sources may carry significant upstream water requirements. Investors and permitting authorities should ask which impact is being reduced, where the burden moves, and whether the receiving system can absorb it.
Metrics That Make Environmental Impact Measurable
A useful measurement framework starts with five linked metrics. None is sufficient alone, because each describes a different layer of the system.
PUE shows facility overhead
Power Usage Effectiveness divides total facility power by IT equipment power:
PUE = total facility power ÷ IT equipment power
If a site draws 120 units of total facility power for 100 units of IT power, its PUE is 1.2. The metric identifies overhead from cooling, conversion, lighting, and other systems. It doesn't show whether the IT load is productive, whether the grid is carbon-intensive, or whether the site is drawing water from a stressed basin.
PUE also varies with weather, season, and operating conditions. A reported annual figure can hide difficult peak periods.
WUE focuses on direct water demand
Water Usage Effectiveness relates annual site water consumption to IT energy:
WUE = annual water consumption ÷ IT equipment energy
A lower WUE generally indicates less direct water consumed per unit of IT energy. Yet WUE can mask the difference between a withdrawal that returns to a system and water consumed through evaporation. It can also make a dry-region facility look efficient while ignoring the severity of local scarcity.
Carbon metrics need a grid boundary
Carbon Usage Effectiveness, or CUE, relates carbon emissions to IT energy:
CUE = total carbon emissions ÷ IT equipment energy
A site should report the emissions boundary, accounting method, and market boundary behind the result. Annual average grid intensity may differ materially from the hourly emissions associated with a workload. Market-based procurement can also produce a different reported result from location-based electricity accounting.
Water stress weighting adds context
A practical extension is Water Stress Weighted WUE:
Stress-weighted WUE = WUE × local water-stress factor
The formula is useful only if the factor is disclosed and consistently defined. It helps distinguish equal volumes consumed in basins with different levels of scarcity, but it doesn't resolve ecological flow requirements, seasonal restrictions, or competing community needs.
IT utilization connects impact to service
IT service utilization links resource use to useful output. Operators can track compute utilization, completed tasks, storage service, or another clearly defined unit of service. This prevents a facility from appearing efficient merely because it operates with low overhead while carrying underused equipment.
Teams evaluating demand forecasts can use data center predictive modeling to examine how projected capacity and workload assumptions affect the assessment. The model is only as credible as the assumptions behind utilization, growth, and operating hours.
| Metric | What It Measures | Formula Basis | Key Limitation |
|---|---|---|---|
| PUE | Facility overhead | Total facility power ÷ IT power | Ignores workload value, weather, and grid mix |
| WUE | Direct water consumption | Site water consumption ÷ IT energy | Can hide withdrawal, seasonality, and watershed stress |
| CUE | Carbon intensity of operations | Carbon emissions ÷ IT energy | Depends on boundary, accounting method, and time window |
| Grid carbon intensity | Emissions from electricity supply | Grid emissions ÷ electricity delivered | Annual averages can hide marginal and hourly conditions |
| Stress-weighted WUE | Water use in local context | WUE multiplied by stress factor | Stress factors may omit ecological and social conditions |
| IT utilization | Useful work from installed capacity | Service output relative to available compute | Output definitions vary across workloads |
A credible disclosure should provide hourly or time-matched carbon information where possible, identify electricity sources, distinguish direct from indirect water, and publish trends rather than one favorable score. Single-number sustainability ratings are convenient, but they can conceal the trade-offs that determine actual impact.
Mitigation Strategies and Their Trade-Offs
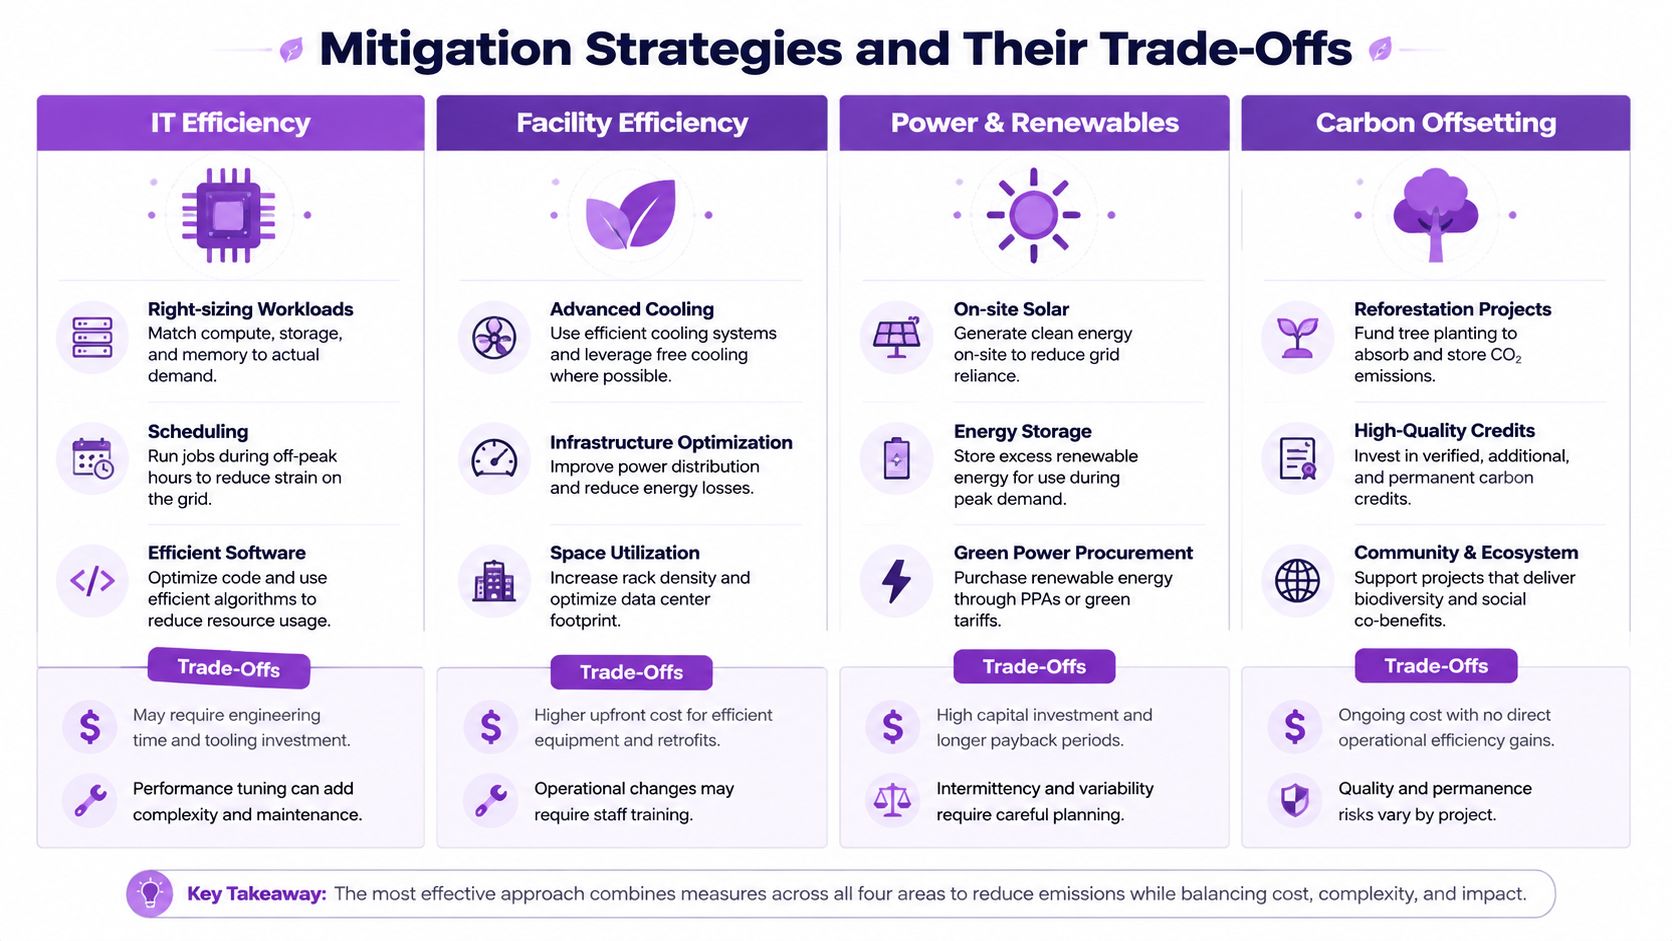
Mitigation works best when operators rank actions by the layer they influence and the time required to implement them. A new hyperscale campus can make structural choices that a colocation retrofit can't, while an edge site may need a simpler approach focused on reliability and local constraints.
IT efficiency changes the demand before infrastructure is built
Right-sizing workloads, consolidating underused systems, selecting efficient chips, and scheduling flexible jobs during lower-carbon hours can reduce electricity demand at the source. These measures often fit both new and existing facilities, although workload deadlines, resilience requirements, and hardware refresh cycles limit how quickly teams can apply them.
The most significant impact comes from reducing energy per unit of useful service. The trade-off is operational complexity. Scheduling can conflict with latency requirements, while aggressive consolidation can reduce redundancy or complicate failure planning.
Facility efficiency moves heat and water
Hot and cold aisle containment, higher supply-air temperatures, free cooling, and liquid cooling can reduce mechanical overhead or support high-density racks. Liquid systems may be well suited to intensive compute, but retrofits require changes to distribution, maintenance procedures, leak detection, and operator training.
Waste heat reuse can create value where a nearby heat customer exists. It isn't a universal solution. Heat demand may be seasonal, geographically distant, or unavailable at the temperature and reliability required.
Power actions shift the supply profile
Long-term renewable contracts, onsite solar, storage, lower-carbon firm power arrangements, and cleaner backup systems can reduce exposure to fossil-heavy supply. These actions vary in additionality, land use, interconnection difficulty, and ability to meet peak demand.
A contract that matches annual consumption doesn't necessarily match hourly load. Onsite generation can improve resilience but may add land, equipment, fuel, and emissions concerns. Storage can reduce generator runtime, but it requires capital and a clear operating strategy.
Siting avoids impacts that efficiency can't remove
A cooler climate, less stressed watershed, and lower-carbon grid can provide structural advantages that equipment upgrades cannot fully reproduce. Site selection is difficult to reverse, so it deserves more scrutiny than a later efficiency retrofit.
A facility profile such as Syracuse University's green data center can help analysts examine how design choices are described at the asset level, but any comparison still needs workload, grid, and watershed context.
| Mitigation family | Environmental leverage | Main trade-off | Retrofit fit | New-build fit |
|---|---|---|---|---|
| IT efficiency | Reduces demand per unit of work | Software and scheduling complexity | High | High |
| Facility efficiency | Cuts overhead or direct water use | Capital cost and maintenance changes | Medium | High |
| Power and renewables | Changes electricity emissions and resilience | Interconnection, land, and matching limits | Medium | High |
| Waste heat reuse | Can displace external heat demand | Requires a nearby, compatible customer | Low to medium | Medium to high |
| Siting | Avoids structural grid and watershed stress | Permitting, network access, and development risk | None after construction | High |
For a hyperscale greenfield, siting, cooling architecture, workload design, and power procurement should be integrated from the start. A colocation retrofit should prioritize measurement, containment, controls, utilization, and targeted cooling upgrades. An edge micro-site may gain more from efficient hardware, passive design, battery-backed resilience, and careful local water review than from complex campus-scale systems.
Regional Scenarios and Capacity Pipelines
A pipeline assessment should compare the same proposed load against the systems available at each destination. The exact building matters, but transmission capacity, permitting timelines, water rights, and generation queues often determine whether the environmental burden remains manageable.
A Nordic pipeline may combine a cool climate with a relatively low-carbon electricity supply and lower water stress. That profile can reduce cooling pressure and operational carbon exposure, but developers still need to assess land, transmission, construction materials, local heat rejection, and the additional demand created by new workloads.
A U.S. Southwest build-out presents a different risk pattern. High ambient temperatures can increase cooling requirements, while water scarcity can make evaporative systems politically difficult. If the local grid is carbon-intensive at the hours of peak demand, a project can face simultaneous carbon, water, transmission, and community opposition risks.
A coal-heavy Asian grid creates another profile. Efficient servers and a strong PUE can reduce demand within the facility, but marginal electricity may still carry high emissions. Efficiency remains valuable, but it doesn't erase the consequences of adding load to a carbon-intensive system.
| Region | Grid Carbon Intensity | Water Stress Level | Primary Risk | Net Impact Profile |
|---|---|---|---|---|
| Nordic location | Lower-carbon supply may be available, subject to local conditions | Potentially lower, but basin-specific review remains necessary | Transmission, land, and pipeline concentration | Favorable operational profile can still create local infrastructure pressure |
| U.S. Southwest | May vary by utility and dispatch period | Often a central siting concern | Cooling demand, water competition, and grid expansion | High sensitivity to cooling design and hourly electricity supply |
| Coal-heavy Asian grid | Marginal supply can be carbon-intensive | Depends on basin and generation mix | Emissions, air quality, and power-system constraints | Facility efficiency may be offset by upstream generation impacts |
Capacity queues change the apparent choice. A site with abundant renewable generation may lack deliverable transmission. A water-secure location may face lengthy permitting. A community may accept a project in principle but reject backup generation, substations, or water commitments after reviewing the full infrastructure package.
The same 100 MW load therefore has no universal environmental meaning. Its effect depends on what generation ramps up, which watershed supplies cooling, what land must be converted, and whether the local system has spare capacity or requires new infrastructure.
Disclosure Rules and the Rebound Challenge
Efficiency metrics can improve while absolute resource use rises. A facility may reduce overhead per unit of IT energy, yet total electricity and water demand can continue growing if operators add more servers, serve more requests, or run more intensive workloads.
The IEA projects that global data center electricity consumption will more than double to around 945 TWh by 2030, compared with about 415 TWh in 2024, in its Energy and AI outlook. That projection illustrates the rebound challenge. Efficiency gains lower the resource cost of each unit of computing, but lower cost can support greater total demand.
What disclosure can reveal
Mandatory and voluntary reporting frameworks can improve comparability when operators disclose consistent boundaries, time periods, source data, and assumptions. Facility-level PUE and WUE are useful starting points, but they don't capture total workload growth, upstream water, grid congestion, embodied construction impacts, or community exposure.
Useful disclosure should identify:
- Absolute electricity demand: Report total consumption alongside efficiency ratios.
- Workload context: Explain utilization, service output, and growth assumptions.
- Water boundaries: Separate onsite consumption, withdrawal, discharge, and electricity-related water.
- Electricity sourcing: Distinguish location-based and market-based accounting, and disclose time matching where available.
- Pipeline effects: Include planned capacity, backup generation, substations, and transmission requirements.
The policy value differs by instrument. Reporting rules primarily make impacts visible. Permits, water conditions, emissions limits, grid-connection requirements, and cost allocation can change project design and behavior directly. Investor scrutiny and community review can influence decisions when disclosures are detailed enough to test claims rather than repeat efficiency scores.
The European Union's movement toward data center energy standards reflects a broader shift from voluntary sustainability language toward performance and disclosure requirements. The practical question for stakeholders isn't whether a facility reports a favorable ratio. It is whether the rule or approval condition changes total demand, resource use, and local risk.
A Practical Environmental Assessment Checklist
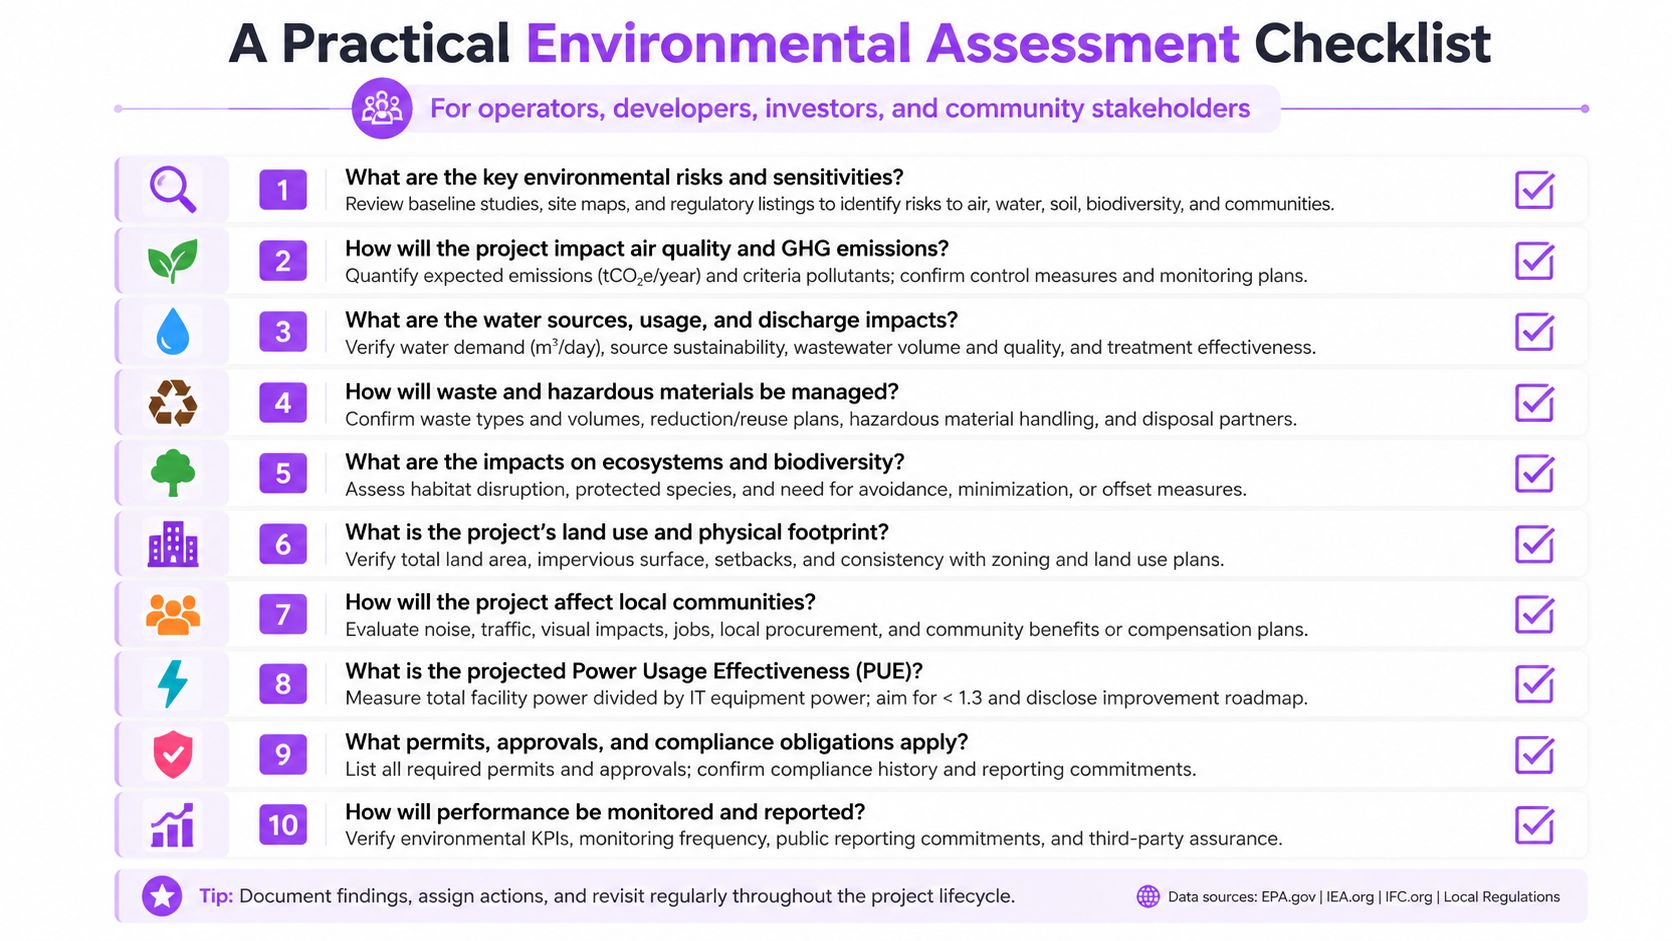
Operators, developers, investors, and communities can screen a project from the workload outward. Each question should be answered with a document, measurement boundary, or site-specific dataset.
- What useful service will the IT load deliver? Verify utilization, workload type, redundancy, and projected growth.
- What is the measured or forecast PUE? Separate annual performance from seasonal and peak conditions.
- What cooling system will operate at peak ambient conditions? Identify direct consumption, withdrawal, discharge, and backup modes.
- What is the site's WUE? Confirm the denominator, reporting boundary, and distinction between consumed and withdrawn water.
- How stressed is the receiving watershed? Review seasonal availability, competing users, ecological requirements, and permitting constraints.
- What electricity will serve the load at the relevant hours? Compare annual average, hourly, and marginal grid conditions.
- How much water is embedded in electricity generation? Add upstream water to direct facility demand rather than reporting cooling alone.
- What new infrastructure is required? Include substations, transmission, roads, generation, fuel storage, and construction land.
- What local air and noise controls apply? Assess generators, cooling equipment, construction periods, monitoring, and nearby sensitive receptors.
- Are claims reported consistently over time? Check absolute demand, efficiency ratios, source disclosure, assumptions, and pipeline changes.
The unresolved issues are often the most important. Public disclosures may not show hourly marginal generation, future workload behavior, indirect water by generation source, cumulative basin demand, or the full land footprint of supporting infrastructure. A defensible assessment should label those uncertainties instead of converting them into a reassuring score.
Data Centers List helps operators, developers, investors, and local stakeholders locate existing, planned, and under-construction facilities while comparing disclosed and AI-estimated capacity information with local context such as water stress. Visit Data Centers List to examine facility locations and pipelines before evaluating a project's electricity, water, land, and community implications.