Data Center Capacity Planning: A Practical Guide
Master data center capacity planning with our practical guide. Learn how to forecast needs, optimize resources, and avoid outages in 2026.
14 min read
You can have a clean rack map, a neat spreadsheet, and a confident handoff from sales, then still miss the core constraint. The deployment slips because the building had space on paper, but the floor did not have live power, the next transformer was still stuck in a utility queue, or the cooling path could not absorb the load that showed up with the last batch of customers.
That is why data center capacity planning has changed. It is no longer a matter of filling white space in a room, it is a discipline for aligning power, cooling, land, and timing against demand that arrives in blocks, not tidy increments. McKinsey's analysis of the market points to a global demand climb of 19% to 22% annually from 2023 to 2030, with demand rising from about 60 GW today toward 171 to 219 GW in the base range and as high as 298 GW in a higher-growth case, while AI-ready capacity demand could rise 33% per year in a midrange case and reach around 70% of total demand by 2030 (McKinsey). Against that backdrop, capacity planning stops being a facilities exercise and becomes a market constraint.
Table of Contents
- Why Most Capacity Plans Fail Before the First Rack Arrives
- Forecasting Demand Over a 3–5 Year Horizon
- Converting Workloads Into Power, Space, and Cooling
- Headroom Buffers and Energised vs Nameplate Capacity
- PUE, Efficiency, and Why Power Is the New Bottleneck
- Using Directory Data for Market-Level Capacity Planning
- A 90-Day Action Plan for the Next Planning Cycle
Why Most Capacity Plans Fail Before the First Rack Arrives
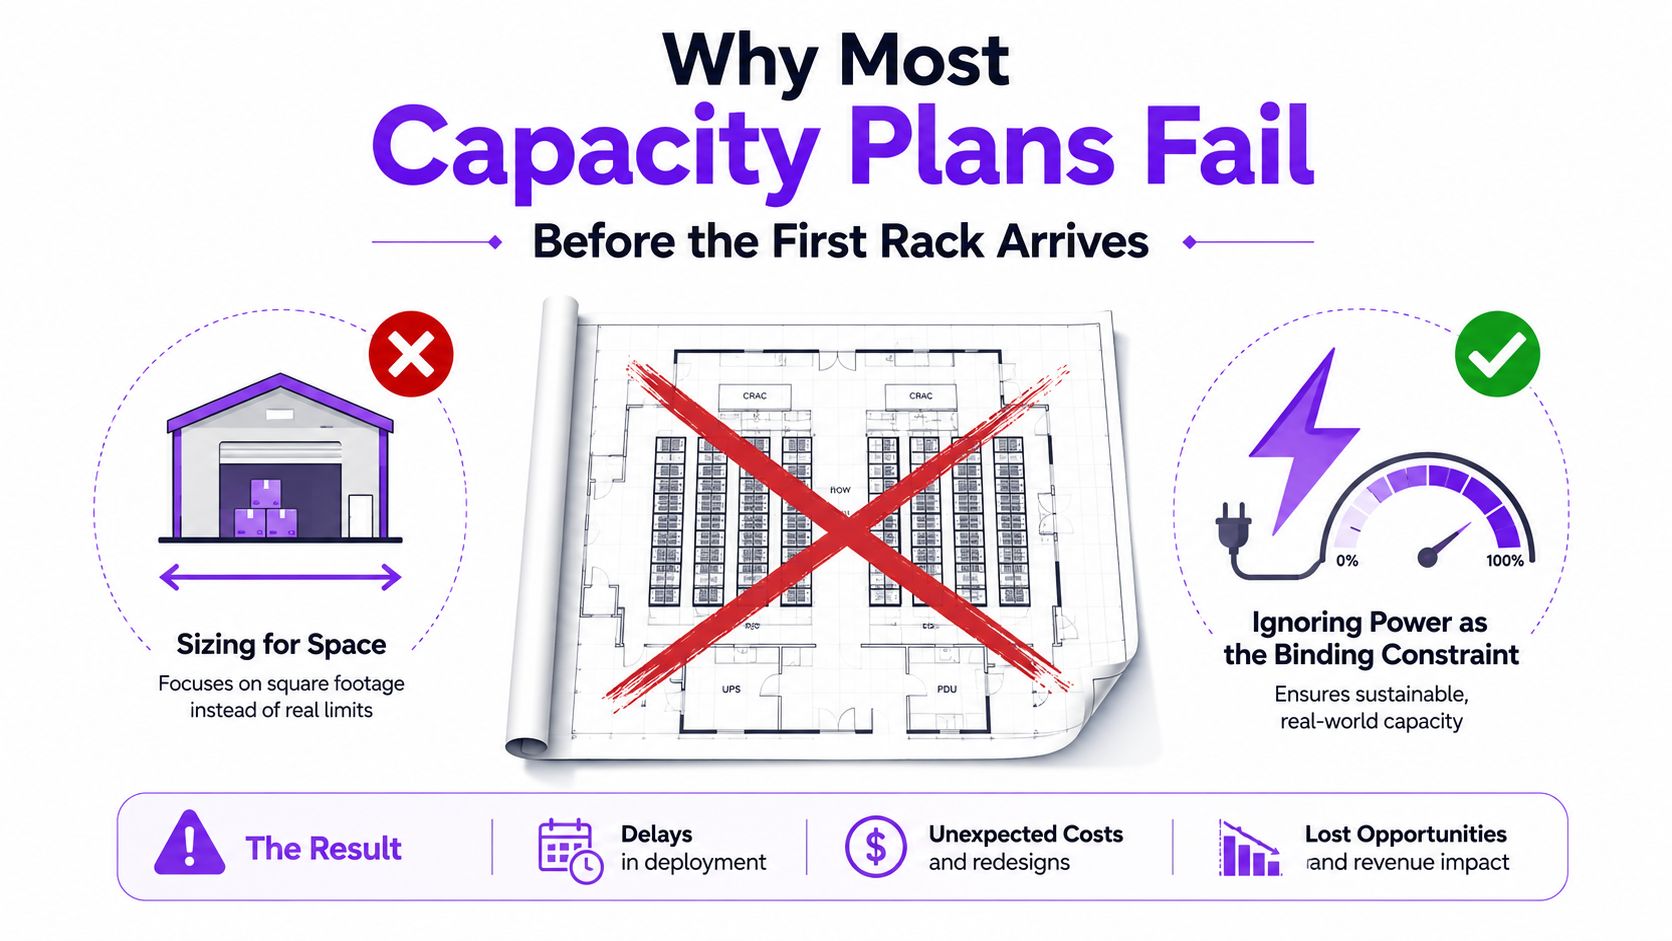
The most common failure is still the oldest one, teams size for floor space first and discover too late that power is the binding constraint. A brochure can show spare rows, but if the substation is not live, the breaker room is tight, or the next utility drop is delayed, the rack never ships. That gap between nameplate capacity and energised capacity is where most deployment schedules break.
The old model was built for smoother demand
Traditional planning assumed gradual growth, average utilization, and plenty of time to adjust. That model worked when demand came in small changes and workloads were relatively stable. It works much less well now, because AI and cloud demand can arrive in large blocks that consume power, cooling, and network headroom at the same time.
The operating problem is not just bigger demand, it is more volatile demand. McKinsey's demand outlook, with global capacity climbing toward 171 to 219 GW by 2030 in the base case and a possible 298 GW in a higher-growth case, shows why present-day utilization cannot be the only input (McKinsey). Planners need to reserve room for growth that may show up as a step change, not a gentle slope.
Efficiency gains are no longer doing the heavy lifting
The easy wins from efficiency improvements are fading. In Uptime Institute's 2025 Global Data Center Survey, the weighted-average annual PUE was 1.54, and that headline figure had shown virtually no change for the sixth consecutive year (Uptime Institute). That matters because many capacity plans still assume the next round of growth can be absorbed by squeezing a little more out of the same footprint.
That is a weak assumption in a market where the physical envelope is already tight. If efficiency is flat and demand is lumpy, the planner's job shifts from optimization to reservation. The strongest plans now protect power, cooling, and expansion rights before they chase the next row.
Practical rule: If a plan only answers how much space is available, it is not a capacity plan yet. It is a floorplan with optimism attached.
Forecasting Demand Over a 3–5 Year Horizon
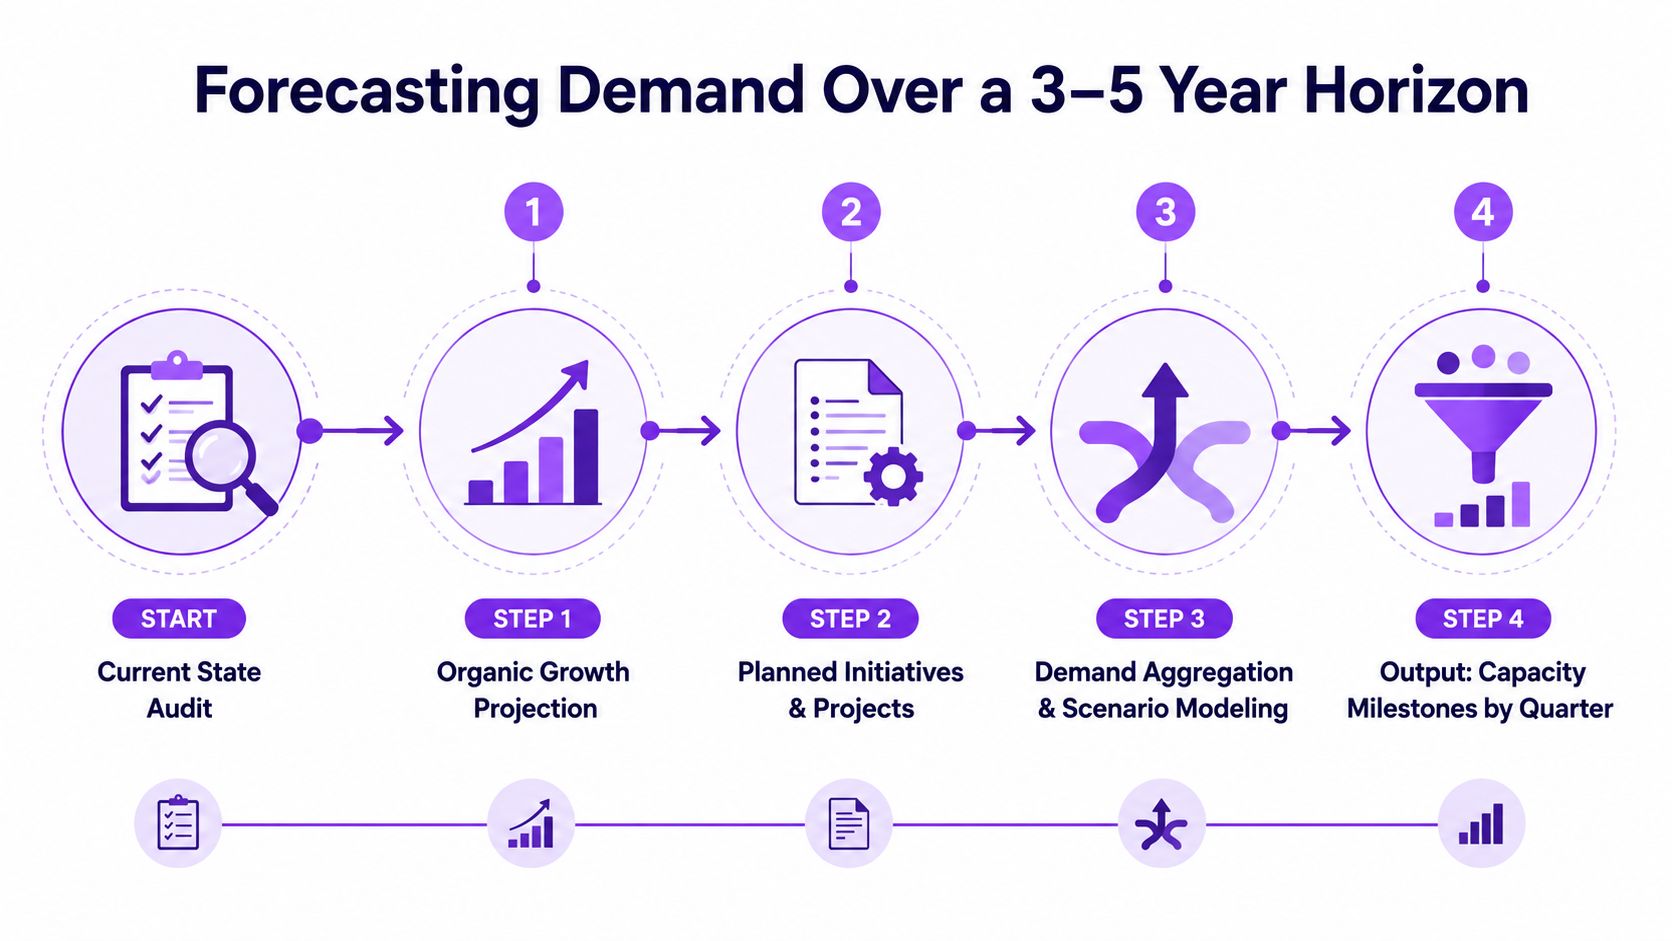
A usable forecast starts with current demand, then separates what is already committed from what is merely plausible. The point is not to build a perfect model, it is to build one that product, finance, and facilities can all defend in the same meeting.
Start with three demand buckets
The cleanest forecast splits demand into organic growth, planned initiatives, and opportunistic wins. Organic growth covers the steady customers, renewals, and normal expansion inside the current base. Planned initiatives cover signed projects, internal migrations, and anything already approved in the business plan. Opportunistic wins are the deals that may close, but are not reliable enough to size the building around on day one.
A working model should keep those buckets separate until the final roll-up. That avoids the classic mistake of averaging everything into one trend line and assuming the business will grow in a straight line. For a mid-size colocation operator, even a steady intake of new customers can hide very different load profiles, because one customer may need modest standard compute while another arrives with AI racks that change the whole power plan.
Use a milestone view, not just a utilization curve
A useful forecast output is a set of capacity milestones by quarter. That forces the planner to answer when a site needs another feeder, another cooling zone, or another block of energized floor. It also creates a timeline that sales can use without overpromising.
Forecasts fail when they only describe average demand. Build them around the quarter when a limit will be hit, because that is when the project manager starts calling.
One clean way to pressure-test the forecast is to ask what happens if the next signed customer is not small enterprise gear, but a dense workload that consumes far more power than the average account. That question matters because a model built on steady-state utilization can look reasonable and still collapse when a lumpy AI deployment lands.
For planners who want to turn this into a repeatable workflow, the internal modeling step can be paired with a market view from predictive modeling guidance so the forecast is not isolated from site realities. The value is not the spreadsheet itself, it is the discipline of reconciling demand, timing, and physical limits before anyone commits space.
Converting Workloads Into Power, Space, and Cooling
Forecasts become useful only when they are translated into rack density, facility load, and thermal demand. This is the point where many spreadsheets get sloppy, because they count racks without checking what those racks draw.
The density bands that matter in practice
A simple sizing reference helps keep the conversation grounded:
| Workload Type | kW per Rack | Typical PUE | Indicative Use |
|---|---|---|---|
| Standard servers | 3–7 kW | 1.3–1.5 | General compute and mixed enterprise loads |
| Storage-heavy racks | 5–10 kW | 1.3–1.5 | Capacity built around storage density |
| GPU and AI racks | 15–40 kW | 1.1–1.5 | Dense AI pods and high-heat deployments |
Those bands come from a practical planning guide that also recommends a 20% to 30% expansion buffer before facility sizing is finalized, along with PUE assumptions around 1.3 to 1.5 for good data centers and 1.1 to 1.2 for hyperscale designs (LinkedIn post). The point is not to force every project into one neat formula. The point is to make the load visible enough that the electrical and cooling teams can react before procurement does.
Convert rack count into facility load
A worked example shows how quickly the numbers move. 200 racks at 12 kW average equals about 2.4 MW of IT load, and at a 1.3 to 1.5 PUE, that becomes roughly 3.1 to 3.6 MW of facility load (LinkedIn post). That is the planning number, because the building has to support the full facility load, not just the IT side.
Once the load is translated, the bottleneck inventory has to be explicit. That means checking power feeds, UPS capacity, breaker limits, cooling zones, and network ports before the plan is frozen. The most common mistake is not underestimating servers, it is overlooking the first downstream limit that runs out.
The spreadsheet should not end at rack count. It should end at the first component that forces a redesign.
Headroom Buffers and Energised vs Nameplate Capacity
The sharpest commercial mistake is confusing what a building can be rated for with what it can deliver today. Nameplate capacity is the theoretical maximum. Energised capacity is what is live, served, and ready for equipment to consume.
Why the distinction changes the buying conversation
A facility can advertise a strong nameplate number and still be unavailable for a specific deployment because the next phase is not energized yet. That is why first-time buyers should ask how many megawatts of energised capacity exist today, what the substation status is for the next phase, and whether adjacent rows or land can be secured for expansion. Digital Edge's buyer guidance frames those questions directly, including the risk of needing to expand later but losing contiguity in the process.
The commercial term matters because it changes how risk is priced. If the next power drop is uncertain, the site is not really ready, even if the brochure says the building has room. Planners need a defensive posture in vendor meetings, because “available soon” can mean very different things depending on utility status and internal phase commitments.
Use headroom as a hard requirement
The practical buffer is still 20% to 30% expansion headroom before final sizing, especially when the workload ramp is uncertain (LinkedIn post). That buffer is not waste, it is what prevents a clean handoff from turning into a second redesign when the first growth tranche lands.
A planner should leave a meeting with four answers, not one:
- How much is live today in energised MW.
- What phase two depends on at the substation.
- Whether adjacent expansion rights exist without losing contiguity.
- How long the next power drop usually takes in practice, not just on paper.
That language keeps the discussion tied to delivery reality instead of brochure capacity. It also helps the planner compare sites on the same basis, which is essential when every provider sounds flexible until the interconnect work starts.
PUE, Efficiency, and Why Power Is the New Bottleneck
The old assumption was that efficiency gains would keep opening room for growth. Current survey results do not support that view. In Uptime Institute's 2025 Global Data Center Survey, the weighted-average annual PUE was 1.54, and the report says that figure has shown virtually no change for the sixth consecutive year (Uptime Institute).
Small density gains do not erase power constraints
Uptime also reports that average server rack power densities are rising slowly, driven by broader adoption of 10 kW to 30 kW racks, while few facilities exceed 30 kW and extreme densities remain rare. The same survey supports both of those points, and the planning message is clear. The market is not shifting into a high-density future all at once, but the facilities that need to support those densities can hit limits quickly.
The right response is to treat power procurement as a first-pass design input. Utility timing, substation readiness, and cooling strategy now decide whether a site can absorb the workload at all.
Market vacancy confirms the same bottleneck
The market data points in the same direction. CBRE reported U.S. data center vacancy at a record low 2.8% in H1 2024, with long electrical utility lead times often stretching multiple years and slowing absorption in core hubs such as Northern Virginia and Austin. JLL, meanwhile, reported global colocation vacancy at 6.6% in late 2024 and pointed to power shortages and permitting delays as major reasons supply is tightening.
That combination changes the planning question. The next decision is which market can realistically deliver power in time, not just which building has open floor area. In campus settings, the same issue shows up in smaller form, which is why the Syracuse University green data center profile is a useful reminder that energised capacity is always an operating question, not just a real estate label.
Power is no longer a utility detail in major markets. It is the gating item that decides whether the plan moves or stalls.
Using Directory Data for Market-Level Capacity Planning
A site shortlist should not be built from instinct alone. A global directory can help a planner test whether a market has real power depth, pipeline visibility, and enough disclosed capacity to support the deployment window.
Use the directory to separate markets that can deliver from markets that only look busy
The useful workflow starts with filtering by capacity, status, and location, then checking ranked views such as Top by Power Capacity and market browse pages for major hubs. The directory's global scope includes 6,052 sites across 175 countries, with status labels for active, planned, and under construction facilities, and it separates disclosed figures from AI-estimated ones so the planner can see where confidence is stronger and where it is more tentative (Data Centers List). That split is valuable because a market with many estimated sites should be treated differently from a market with more disclosed capacity.
The method is simple. First, shortlist markets with enough published scale. Then check whether the pipeline is active or merely theoretical. Finally, compare that market signal against the utility reality already known from the demand plan. If the site needs to go live within 18 months, markets with long utility lead times should fall down the list quickly, even if they look attractive on footprint alone.
Build a shortlist for a 10 MW AI deployment
A 10 MW AI deployment forces the issue because it cannot hide behind low-density assumptions. The shortlist should focus on markets where energised capacity exists now, where the under-construction pipeline is visible, and where there is enough surrounding depth to support the next phase. Quick-browse views for hubs like Northern Virginia, Dublin, Frankfurt, and London help compare market shape at a glance, while the ranked capacity list helps identify where large facilities are already concentrated (Data Centers List).
The planner should then separate disclosed capacity from estimated capacity before committing. A disclosed figure can support a firmer operating assumption, while an estimate should trigger more verification. That does not make estimated data useless, but it does mean the confidence level has to be lower when the deployment deadline is tight.
A market shortlist is only useful if it answers one question cleanly, can power actually be delivered there on the schedule the business needs?
A 90-Day Action Plan for the Next Planning Cycle
The next planning cycle should move in three deliberate passes, not one giant spreadsheet refresh. In the first 30 days, the planning lead should refresh the demand forecast, separate organic growth from signed projects, and build the bottleneck inventory for power, cooling, and network. In the next 30 days, the team should convert that forecast into MW, validate the headroom buffer, and test the energised-versus-nameplate gap with vendor meetings.
In the final 30 days, market selection gets its own review. The shortlist should be checked against directory data, ranked capacity views, and known pipeline depth before any site is reserved. That is also when the team should decide which adjacent expansion rights matter, which utility interconnect windows need to be held, and which markets no longer deserve capital attention.
A good planning rhythm leaves the team with fewer surprises and cleaner decisions. It also keeps the conversation honest about what is live, what is promised, and what is merely hoped for.
Build for the demand you can see, reserve for the demand you can defend, and refuse to commit for the demand you are hoping for.
Data Centers List makes this work more practical by putting facility status, location, and power capacity into one searchable directory, so planners can pressure-test market selection before they lock a site. Use Data Centers List to compare capacity, status, and pipeline visibility against the demands of your next build, then take the shortlist into vendor and utility conversations with a clearer view of what is energised.