Top 7 Data Center Capacity Planner Tools for 2026
Explore the top 7 data center capacity planner tools, frameworks, and calculators for 2026. Master forecasting for power, cooling, space, and more.
13 min read
Global data center capacity is no longer a clean spreadsheet problem. Uptime Institute's 2024 global survey of 526 operators and managers found average PUE at 1.56, while the most common rack density band still sits at 4 kW to 6 kW, which shows how many facilities are still planning around conservative load profiles even as demand shifts upward. At the same time, capacity now means more than floor space or server counts, it means balancing power, cooling, space, storage, network, and utilization against real grid and thermal limits. A modern data center capacity planner needs a layered toolkit that connects facility design, workload forecasting, and market intelligence. The seven tools below follow that workflow from foundational frameworks to rack-level execution and regional site selection.
Table of Contents
- 1. Uptime Institute Tier Classification System
- 2. PUE Calculator and Benchmarking Framework
- 3. Capacity Planning Spreadsheet Templates
- 4. The Green Grid Water Usage Effectiveness Methodology
- 5. Moore's Law and Workload Density Forecasting Framework
- 6. Rack Power Distribution Unit Capacity Planning Calculator
- 7. Regional Market Analysis and Site Selection Framework
- 7-Point Data Center Capacity Planning Comparison
- Build Your Integrated Capacity Planning Toolkit
1. Uptime Institute Tier Classification System
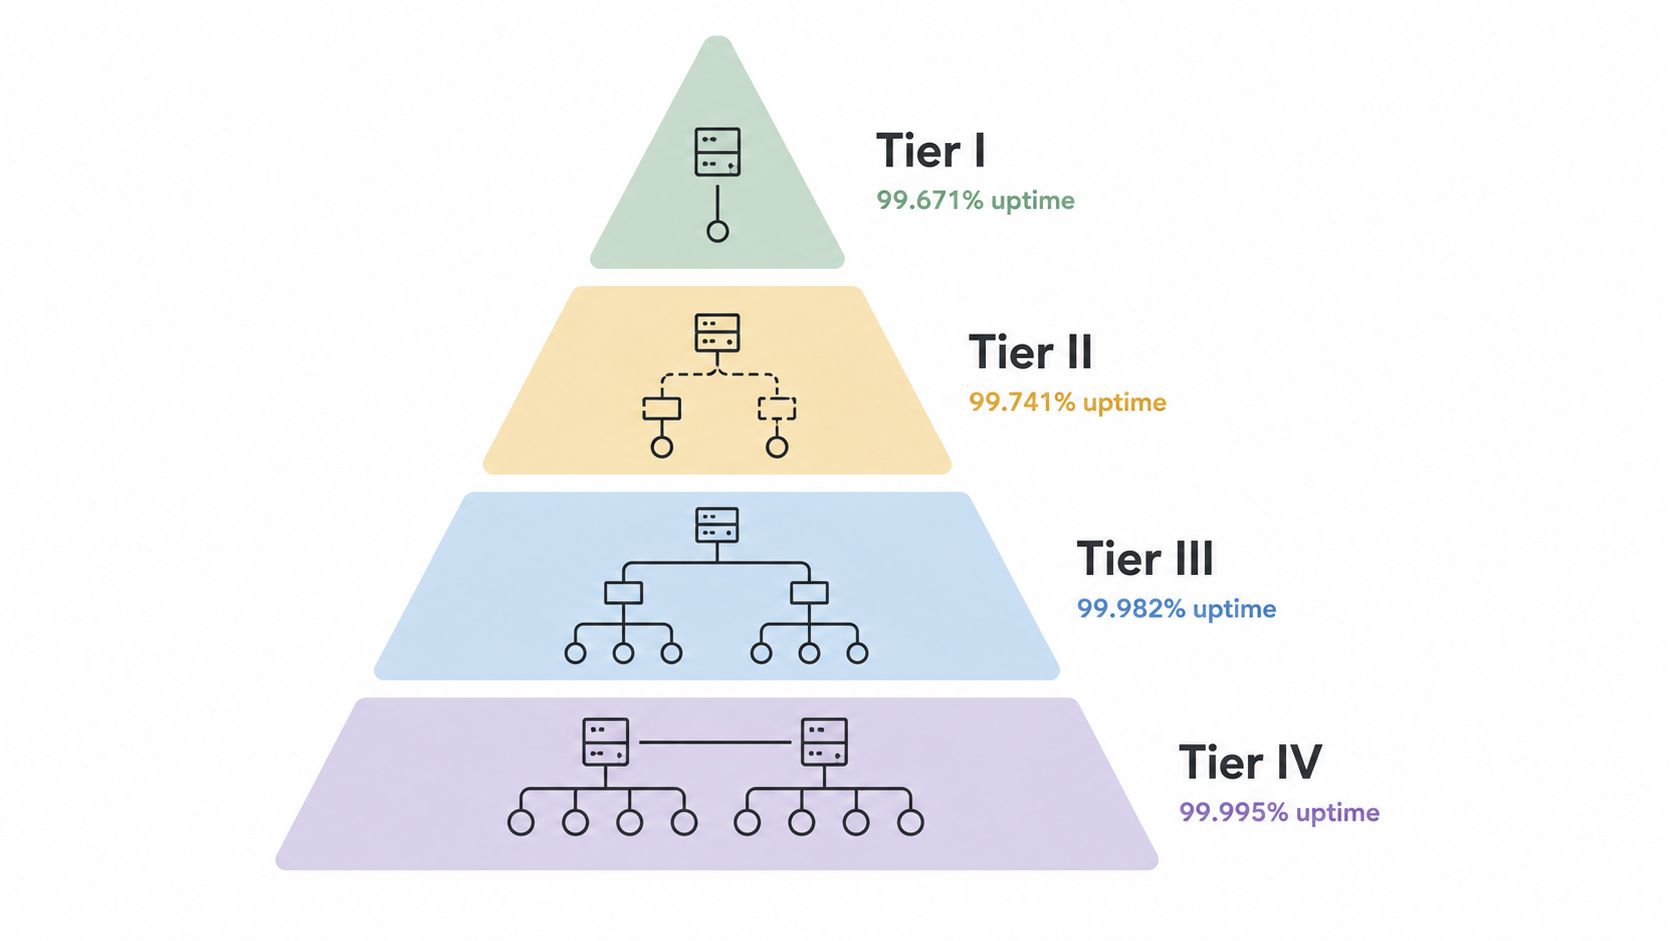
The Tier model gives a data center capacity planner a language for resilience before any electrical one-line gets finalized. It separates facilities by redundancy and fault tolerance, so the planning conversation starts with service expectations, not just cabinet counts. That matters because a site built for basic availability has very different capacity headroom requirements than one designed for continuous operations.
In practice, the Tier target should be chosen before expansion work starts. A colo operator selling to enterprise tenants needs to document how its design matches customer commitments, while a hyperscale team may use the same framework to standardize deployment assumptions across multiple regions. The internal profile for Baltneta Tier 3 Data Center in Vilnius is a useful example of how facility classification can be used to anchor market-facing capacity discussions.
Practical rule: Capacity planning gets cleaner when the resilience target is fixed first. Otherwise, teams end up overbuilding some layers and underbuilding others.
Why tier choice changes the whole design
A Tier I or Tier II mindset can encourage a planner to treat spare capacity as a cushion. A Tier III or Tier IV environment changes that logic, because maintenance paths, fault domains, and operational continuity all have to be modeled up front. That shift affects power topology, cooling loops, generator assumptions, and the timing of expansion phases.
The best planners also treat Tier certification timelines as part of the schedule, not an afterthought. If a project's commercial launch depends on a specific operational profile, then the certification work has to sit inside the critical path, alongside utility coordination and tenant fit-out. That is where Tier standards become a capacity tool, not just a compliance label.
2. PUE Calculator and Benchmarking Framework
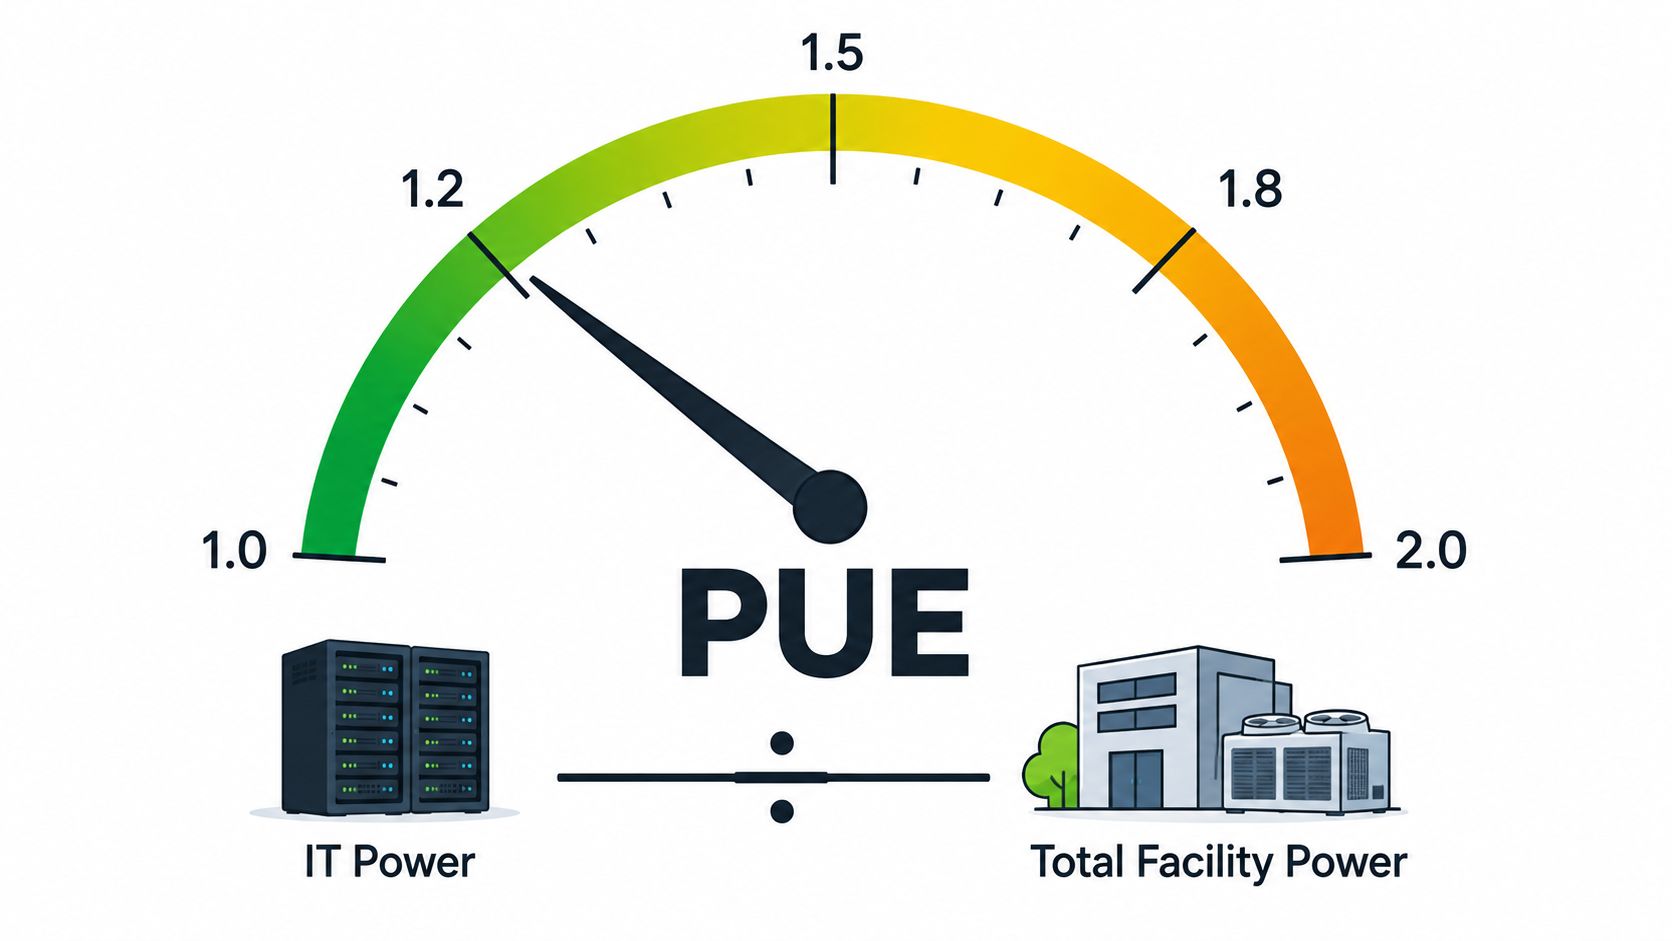
PUE is one of the few metrics that lets a data center capacity planner compare efficiency across facilities without losing sight of the power stack. Uptime Institute's 2024 survey put the average at 1.56, which is a useful benchmark because it shows how much facility overhead still sits above IT load in many real deployments. EPRI's definition also matters here, because it frames capacity as the power a data center can supply or draw at a moment in time, measured in watts, which keeps the conversation focused on actual headroom rather than accounting abstractions. The benchmark is most useful when it is tied to a calculator, not used as a vanity number.
PUE works best when it's tracked against changes in cooling strategy, IT mix, and density. A planner reviewing a retrofit in a mature campus can use a baseline PUE to show whether new chillers, airflow changes, or containment upgrades are improving the facility position. In mixed portfolios, the same metric helps separate sites that need operational tuning from sites that need structural reinvestment.
Practical rule: A PUE target without a measurement cadence is just a slogan.
A good benchmarking framework also helps leadership make investment trade-offs. If cooling upgrades lower facility overhead, the benefit is not only efficiency, it's the ability to support more IT load within the same electrical envelope. That's why mature operators use PUE as part of a capacity planning review cycle, not as a standalone sustainability report figure.
3. Capacity Planning Spreadsheet Templates
Spreadsheets still matter because they translate strategic assumptions into something a facilities team can challenge line by line. For a data center capacity planner, a structured template is the bridge between business forecasts and operational constraints. It usually tracks power, cooling, floor space, and network headroom over a multi-year horizon, then layers in scenarios for growth, retirements, and phased expansion.
The value comes from the discipline of versioning and assumption control. A template with dated tabs, clear calculation logic, and quarterly utilization updates is far safer than a static workbook passed around by email. That is especially true in colocation and edge portfolios, where one customer change can alter available headroom for an entire row or suite.
What strong templates actually track
- Rack and row utilization: These fields show where capacity is already spoken for, and where incremental load can still fit.
- Scenario variance: A planner should test optimistic, base, and conservative cases, because workload demand rarely follows a straight line.
- Equipment retirements: Old assets create hidden relief if they're scheduled correctly, and hidden risk if they are forgotten.
- Facility type splits: Colocation, hyperscale, and edge sites rarely behave the same way, so one model shouldn't force identical assumptions across all three.
The best templates also connect to DCIM data rather than living in isolation. That lets planners compare forecasted usage with actual telemetry and catch drift early. When leadership asks why a site looks full on paper but still has a few cabinets available, the answer usually sits in the assumptions, not the spreadsheet software.
4. The Green Grid Water Usage Effectiveness Methodology
Water has become a capacity variable, not just a sustainability talking point. For a data center capacity planner, WUE matters because cooling design now has to be tested against regional water stress, regulatory pressure, and the growth of denser workloads. If a facility can't sustain its cooling approach over time, then its nominal electrical headroom doesn't tell the full story.
The methodology helps. It gives planners a way to compare water consumption against IT load and decide whether a proposed design fits the site's local reality. That is especially important in regions where seasonal availability changes or where public scrutiny makes water-heavy designs harder to defend.
A useful planning habit is to pair WUE review with regional overlays before a project advances too far. Data Centers List's location intelligence and water-stress overlays in its global directory can help planners spot regions where water constraints deserve early attention. That's more valuable than discovering a constraint after permits, utility work, and design spending are already locked in.
Water efficiency is no longer just a sustainability metric, it's a deployment filter.
The strategic point is simple. Sites with strong water efficiency options can absorb more high-density growth without forcing a redesign. Sites that depend on water-intensive cooling may still work, but only if the local context supports them and the forecasted load stays within a practical thermal envelope. A planner who ignores that trade-off is really planning for a facility that might look viable only on paper.
5. Moore's Law and Workload Density Forecasting Framework
A density forecast is where many capacity plans either become credible or fall apart. The hardware roadmap changes faster than most facility refresh cycles, and AI workloads have pushed that gap wider. In the 2025 Uptime Institute survey, adoption of 10–30 kW racks is described as strong, while ≥50 kW racks remain material and rising in some deployments, which means a planner can't size a new build around legacy averages and call it done.
A practical forecasting framework starts by segmenting workloads. Traditional enterprise applications, AI training, inference, and HPC all drive different heat and power profiles, so each one should have its own density assumption. A mixed-density hall needs electrical and thermal headroom at the row and zone level, not just a broad site-wide reserve.
How the density lens changes design choices
If a facility is likely to absorb heavier GPU loads, then the planner has to think beyond standard air cooling assumptions. That affects aisle design, cooling architecture, electrical distribution, and the future retrofit path. The question isn't only how much power a room can deliver today, it's whether the room can handle a denser load without a costly redesign later.
A useful planning discipline is to review workload assumptions regularly, then compare them with vendor roadmaps and customer commitments. That doesn't mean predicting every chip generation, it means not locking a site into a thermal model that fails as soon as customer mix changes. For a data center capacity planner, density forecasting is really a risk-control tool.
6. Rack Power Distribution Unit Capacity Planning Calculator
Rack-level planning is where the abstract model gets tested against real equipment. A data center capacity planner who skips the PDU layer can end up with a facility that looks balanced at the room level but fails when actual loads get plugged in. The right calculator checks outlet density, branch circuit sizing, A/B feed design, and future headroom for each rack, not just the row total.
Modern sites are rarely uniform. One rack may carry lightweight network gear, while the next holds denser compute or storage. A rack-level calculator lets the team size the electrical path for the actual equipment mix instead of assuming every cabinet behaves the same.
The safest rack plan is the one that leaves room for the customer's next refresh cycle.
That approach also helps with customer conversations. If a colo account is approaching its local power ceiling, the operator can respond before the rack becomes a problem, instead of reacting after alarms fire. It also gives real estate and design teams a clearer view of where electrical infrastructure costs are likely to rise as deployment density increases.
The strongest planners keep a live record of typical customer draws, then use metered PDUs to compare estimated and actual consumption. That closes the loop between sales assumptions, design specs, and live operations. It's the difference between signing a contract and being able to support the deployment cleanly.
7. Regional Market Analysis and Site Selection Framework
Regional analysis is the point where a data center capacity planner stops asking only what the facility can hold and starts asking what the market can physically deliver. In several major markets, power availability has become the binding constraint, and recent reporting shows some utility queues pushing delivery into the 2030s in Northern Virginia, while the Irish grid operator warned that Dublin faced severe constraints for new large loads. That changes site selection from a real estate exercise into a power-access strategy.
The best framework combines geospatial analysis, regulatory mapping, and pipeline visibility. It should account for fiber, grid capacity, labor, climate, water, and permitting conditions, because a site that looks good on one axis can fail on another. For market research, Data Centers List offers an interactive facility directory and regional browse views that help planners compare existing, planned, and under-construction sites alongside operator and status data.
What a regional model should surface
- Power feasibility: Whether the local grid can support the load within the needed time frame.
- Water and climate risk: Whether cooling assumptions fit the region's constraints.
- Pipeline visibility: Whether nearby development is already consuming the same utility headroom.
- Competitive context: Whether the market is already crowded with similar customer profiles.
This is also where a planner avoids false confidence from land availability. Plenty of sites still have acreage, but that doesn't mean they have usable power or realistic connection timelines. A regional framework forces the team to compare what can be built with what can come online.
7-Point Data Center Capacity Planning Comparison
| Item | Core features | Key metrics / quality | Primary value proposition | Target audience | Limitations & cost |
|---|---|---|---|---|---|
| Uptime Institute Tier Classification System | Four-tier infrastructure specs, redundancy rules, certification & audit process | Uptime % by Tier (Tier I 99.671 → Tier IV 99.995); certification status | Standardizes resilience, SLAs and operator benchmarking | Capacity planners, operators, colo providers, auditors | Certification 비용, static model vs emerging tech, not cloud/edge-specific |
| PUE (Power Usage Effectiveness) Calculator & Benchmarking | PUE ratio calc, real-time & historical tracking, BMS integration, benchmarks | PUE value (1.0 ideal; industry best ~1.1–1.8); monthly trends | Drives energy-efficiency decisions, lowers OPEX and supports ESG reporting | Operators, sustainability teams, engineers, planners | Requires granular metering; climate/workload blind; can be gamed; low/free tools |
| Capacity Planning Spreadsheet Templates (DCIM Integration) | Pre-built forecasting templates, multi-scenario models, DCIM import points | MW, kW/rack, space utilization, cost & ROI projections | Fast customizable forecasting and scenario planning with low entry barrier | Capacity planners, consultants, small-to-mid operators | Manual entry errors, limited real-time scaling, depends on user discipline; low cost |
| The Green Grid WUE Methodology | Standardized WUE calc, regional benchmarks, water reuse & seasonal modeling | WUE (liters/kWh), regional adjustments, seasonal variance | Quantifies water risk, informs cooling choices and regulatory/ESG compliance | Planners, sustainability leads, regulators, operators in water-stressed regions | Needs detailed water metering; regional variability; less mature than PUE |
| Moore's Law & Workload Density Forecasting Framework | Semiconductor roadmap integration, workload segmentation, rack density forecasting | kW/rack trends (typical 5–15 kW → trending 20+ kW); adoption curves | Long-term capacity foresight to future-proof power & cooling investments | Hyperscalers, strategic planners, engineers, investors | Forecast uncertainty, technology disruption risk, regional variation |
| Rack PDU Capacity Planning Calculator | Server power lookup DB, redundancy (A/B), voltage-drop and cable sizing, outlet optimization | Outlet density, feed capacity, suggested headroom (%) | Prevents over-subscription, optimizes rack-level power and reliability | Data center engineers, colo ops, electrical contractors | Often vendor-specific; needs accurate equipment specs; forecasting limits |
| Regional Market Analysis & Site Selection Framework (Geospatial) | GIS mapping of facilities, fiber/grid/water/regulatory mapping, market scoring | Market/site scores, capacity pipeline stats, connectivity density | Holistic site selection & market benchmarking to reduce expansion risk | Real estate/site selection teams, investors, operators, strategy teams | Data-intensive, requires GIS/analyst expertise, significant upfront investment |
Build Your Integrated Capacity Planning Toolkit
Effective data center capacity planning isn't about finding one perfect tool. It's about building a stack that starts with Tier standards, checks efficiency with PUE, tests water exposure with WUE, forecasts density growth, sizes racks at the PDU level, and validates site decisions against regional power reality. That layered workflow is what keeps a data center capacity planner from relying on one optimistic assumption that breaks the rest of the model.
The strongest operators treat these tools as a sequence, not a menu. They define the resilience target first, measure facility efficiency next, then test workload density and rack-level electrical design before they commit capital to a region or a build phase. When that sequence is tied to real market intelligence, the planning process gets harder to fool and easier to defend.
Data Centers List fits naturally into that final layer because it brings facility status, location context, and capacity signals into one browseable directory. Its mix of disclosed and estimated power data can help teams cross-check internal assumptions against the market before they lock in a site plan or expansion schedule.
If you're mapping new capacity, validating a regional buildout, or comparing facility pipelines, visit Data Centers List to review site-level power data, status labels, and market context in one place. It's a practical way to ground capacity assumptions in current facility and regional information before the next planning cycle begins.